Assessing the Benefits Reform in Slovenia Using a Microsimulation ...
Assessing the Benefits Reform in Slovenia Using a Microsimulation ...
Assessing the Benefits Reform in Slovenia Using a Microsimulation ...

Create successful ePaper yourself
Turn your PDF publications into a flip-book with our unique Google optimized e-Paper software.
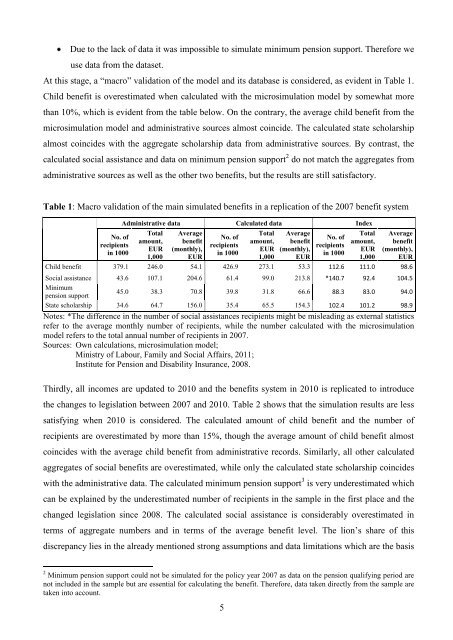
Due to <strong>the</strong> lack of data it was impossible to simulate m<strong>in</strong>imum pension support. Therefore weuse data from <strong>the</strong> dataset.At this stage, a “macro” validation of <strong>the</strong> model and its database is considered, as evident <strong>in</strong> Table 1.Child benefit is overestimated when calculated with <strong>the</strong> microsimulation model by somewhat morethan 10%, which is evident from <strong>the</strong> table below. On <strong>the</strong> contrary, <strong>the</strong> average child benefit from <strong>the</strong>microsimulation model and adm<strong>in</strong>istrative sources almost co<strong>in</strong>cide. The calculated state scholarshipalmost co<strong>in</strong>cides with <strong>the</strong> aggregate scholarship data from adm<strong>in</strong>istrative sources. By contrast, <strong>the</strong>calculated social assistance and data on m<strong>in</strong>imum pension support 2 do not match <strong>the</strong> aggregates fromadm<strong>in</strong>istrative sources as well as <strong>the</strong> o<strong>the</strong>r two benefits, but <strong>the</strong> results are still satisfactory.Table 1: Macro validation of <strong>the</strong> ma<strong>in</strong> simulated benefits <strong>in</strong> a replication of <strong>the</strong> 2007 benefit systemNo. ofrecipients<strong>in</strong> 1000Adm<strong>in</strong>istrative data Calculated data IndexTotalamount,EUR1,000Averagebenefit(monthly),EURNo. ofrecipients<strong>in</strong> 1000Totalamount,EUR1,000Averagebenefit(monthly),EURNo. ofrecipients<strong>in</strong> 1000Totalamount,EUR1,000Averagebenefit(monthly),EURChild benefit 379.1 246.0 54.1 426.9 273.1 53.3 112.6 111.0 98.6Social assistance 43.6 107.1 204.6 61.4 99.0 213.8 *140.7 92.4 104.5M<strong>in</strong>imumpension support45.0 38.3 70.8 39.8 31.8 66.6 88.3 83.0 94.0State scholarship 34.6 64.7 156.0 35.4 65.5 154.3 102.4 101.2 98.9Notes: *The difference <strong>in</strong> <strong>the</strong> number of social assistances recipients might be mislead<strong>in</strong>g as external statisticsrefer to <strong>the</strong> average monthly number of recipients, while <strong>the</strong> number calculated with <strong>the</strong> microsimulationmodel refers to <strong>the</strong> total annual number of recipients <strong>in</strong> 2007.Sources: Own calculations, microsimulation model;M<strong>in</strong>istry of Labour, Family and Social Affairs, 2011;Institute for Pension and Disability Insurance, 2008.Thirdly, all <strong>in</strong>comes are updated to 2010 and <strong>the</strong> benefits system <strong>in</strong> 2010 is replicated to <strong>in</strong>troduce<strong>the</strong> changes to legislation between 2007 and 2010. Table 2 shows that <strong>the</strong> simulation results are lesssatisfy<strong>in</strong>g when 2010 is considered. The calculated amount of child benefit and <strong>the</strong> number ofrecipients are overestimated by more than 15%, though <strong>the</strong> average amount of child benefit almostco<strong>in</strong>cides with <strong>the</strong> average child benefit from adm<strong>in</strong>istrative records. Similarly, all o<strong>the</strong>r calculatedaggregates of social benefits are overestimated, while only <strong>the</strong> calculated state scholarship co<strong>in</strong>cideswith <strong>the</strong> adm<strong>in</strong>istrative data. The calculated m<strong>in</strong>imum pension support 3 is very underestimated whichcan be expla<strong>in</strong>ed by <strong>the</strong> underestimated number of recipients <strong>in</strong> <strong>the</strong> sample <strong>in</strong> <strong>the</strong> first place and <strong>the</strong>changed legislation s<strong>in</strong>ce 2008. The calculated social assistance is considerably overestimated <strong>in</strong>terms of aggregate numbers and <strong>in</strong> terms of <strong>the</strong> average benefit level. The lion’s share of thisdiscrepancy lies <strong>in</strong> <strong>the</strong> already mentioned strong assumptions and data limitations which are <strong>the</strong> basis2 M<strong>in</strong>imum pension support could not be simulated for <strong>the</strong> policy year 2007 as data on <strong>the</strong> pension qualify<strong>in</strong>g period arenot <strong>in</strong>cluded <strong>in</strong> <strong>the</strong> sample but are essential for calculat<strong>in</strong>g <strong>the</strong> benefit. Therefore, data taken directly from <strong>the</strong> sample aretaken <strong>in</strong>to account.5