Multivariate Gaussianization for Data Processing
Multivariate Gaussianization for Data Processing
Multivariate Gaussianization for Data Processing

Create successful ePaper yourself
Turn your PDF publications into a flip-book with our unique Google optimized e-Paper software.
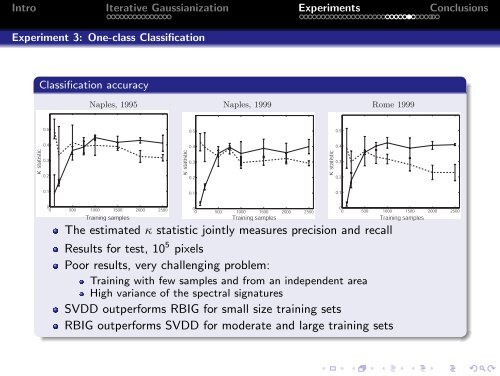
crosses represent outliers of different nature. The figures show the classification boundaries found by SVDD (left) andIntro G-PCA (right) whenIterative trained using <strong>Gaussianization</strong> a restricted set of outliers (crosses). Experiments ConclusionsExperiment method <strong>for</strong>3: small One-class size training Classification sets. This is because more target samples are needed by the G-PCA <strong>for</strong> anaccurate PDF estimation. However, <strong>for</strong> moderate and large training sets the proposed method substantiallyoutper<strong>for</strong>ms SVDD. Note that training size requirements of G-PCA are not too demanding: 750 samples on a10-dimensional problem are enough <strong>for</strong> G-PCA to outper<strong>for</strong>m SVDD when very little is known of the non-targetclass. Classification accuracyNaples, 1995 Naples, 1999 Rome 19990.50.50.5κ statistic0.40.30.2κ statistic0.40.30.2κ statistic0.40.30.20.10.10.100 500 1000 1500 2000 2500Training samples00 500 1000 1500 2000 2500Training samplesThe estimated κ statistic jointly measures precision and recall00 500 1000 1500 2000 2500Training samplesFigure 5. Classification per<strong>for</strong>mance (κ statistics) as a function of the number of training samples <strong>for</strong> the three consideredimages by the SVDD (dashed) and the G-PCA (solid)..Results <strong>for</strong> test, 10 5 pixelsPoor results, very challenging problem:Figure 6 shows Training the classification with few samples maps using and a restricted from antraining independent strategy. area In this case, the experiment wascarried out over High a small variance region (200 of the × 200) spectral of thesignaturesNaples 1995 image. We used 2000 samples of the target classand only 10 samples of the non-target class. Here the classification per<strong>for</strong>mance (κ statistic) is better thanSVDD outper<strong>for</strong>ms RBIG <strong>for</strong> small size training setsthe results reported in Fig. 5 because small regions have more homogeneous features, and then the varianceof spectral RBIG signatures outper<strong>for</strong>ms is smaller. SVDD As a consequence, <strong>for</strong> moderate the training and large data describes trainingmore sets accurately the particularbehavior of the smaller spatial region thus achieving a better per<strong>for</strong>mance in the test set.Note that, although the SVDD classification map is more homogeneous, G-PCA better rejects the ‘nonurban’areas (in black). This may be because SVDD training with few non-target data gives rise to a too broad