DRAFT
FY 2020 - PSTA
FY 2020 - PSTA
- No tags were found...

You also want an ePaper? Increase the reach of your titles
YUMPU automatically turns print PDFs into web optimized ePapers that Google loves.
PINELLASSUNCOASTTRANSITAUTHORITYTransitDevelopmentPlanFY2011–FY2020<strong>DRAFT</strong>Prepared For:Pinellas Suncoast Transit Authority3201 Scherer DriveSt. Petersburg, FL 33716Phone: (727) 540-1800Fax: (727) 540-1913Prepared By:Tindale-Oliver & Associates, Inc.1000 N. Ashley Drive, Suite 100Tampa, FL 33602Phone: (813) 224-8862Fax: (813) 226-2106
TABLE OF CONTENTSSection 1: INTRODUCTION ............................................................................................................. 1-1State of Florida Public Transportation Block Grant ......................................................... 1-1Organization of Report .................................................................................................... 1-3Section 2: TRANSIT PLANNING AND POLICY DOCUMENTS ..................................................... 2-1Federal Plans and Policies .............................................................................................. 2-1State of Florida Plans and Policies .................................................................................. 2-3Local Plans and Policies ................................................................................................ 2-6Summary .................................................................................................................... 2-13Section 3: STUDY AREA CONDITIONS AND DEMOGRAPHIC CHARACTERISTICS ................ 3-1Service Area Description ................................................................................................ 3-1Demographic Information ............................................................................................... 3-1Land Use Information ...................................................................................................... 3-16Commuting Patterns ....................................................................................................... 3-25Roadway Conditions ...................................................................................................... 3-26Conclusion .................................................................................................................... 3-27Section 4: EXISTING PTSA SERVICE LEVELS ............................................................................ 4-1Existing Service ............................................................................................................. 4-1Operating Statistics ........................................................................................................ 4-11Performance Evaluation and Trends .............................................................................. 4-25Peer Review ................................................................................................................... 4-30Section 5: MARKET RESEARCH AND PUBLIC INVOLVEMENT ................................................. 5-1On-Going Community Outreach Program ....................................................................... 5-12010 PSTA Market Research Study ............................................................................... 5-6PSTA 2010 On-Board Survey ......................................................................................... 5-62010 Medicaid Bus Pass User Survey ............................................................................ 5-10Medicaid Buss Pass Survey Results ............................................................................... 5-10Committees and Workshops ........................................................................................... 5-19Pinellas County Transportation Task Force .................................................................... 5-27Transit Funding Committee ............................................................................................. 5-27PSTA Vision .................................................................................................................... 5-28Tindale-Oliver & Associates, Inc.Pinellas Suncoast Transit AuthoritySeptember 2010 i Transit Development Plan
Map 3-9 Dwelling Unit Density by TAZ (2010 and 2020) ............................................................... 3-18Map 3-10 Major Trip Generators and Attractors .............................................................................. 3-20Map 3-11 Pinellas County DRI Coverage ....................................................................................... 3-24Map 3-12 MPO Committed Roadway Projects ................................................................................ 3-28Map 4-1 ¼-mile Buffer Service Area ............................................................................................. 4-2Map 4-2 ¾-mile Buffer Service Area ............................................................................................. 4-3Map 4-3 PSTA Existing Service .................................................................................................... 4-4Map 5-1 Origin-Destination Map ................................................................................................... 5-9Map 6-1 PSTA 2020 Ridership Forecast Percent Change ............................................................ 6-19Map 7-1 Alternatives Analysis Corridors ....................................................................................... 7-11Map 7-2 Crossbay Express Bus Connectors ................................................................................. 7-12Map 7-3 Premium Bus Network .................................................................................................... 7-13Map 7-4 PSTA 2035 Transit Vision ............................................................................................... 7-14LIST OF FIGURESFigure 3-1 Median Age .................................................................................................................... 3-6Figure 3-2 Pinellas County Tourist Trends ....................................................................................... 3-14Figure 3-3 2008 Pinellas County Average Tourist Trip Budget ......................................................... 3-16Figure 3-4 Annual Average Daily Traffic (AADT).............................................................................. 3-26Figure 3-5 Vehicles Miles Traveled (VMT) ....................................................................................... 3-26Figure 3-6 % Roadways Above Capacity ......................................................................................... 3-27Figure 3-7 Volume/Capacity (V/C) Ratio .......................................................................................... 3-27Figure 3-8 Housing Costs and Household Income ........................................................................... 3-30Figure 4-1 FY 2009/10 Operating Budget by Revenue Source ........................................................ 4-11Figure 4-2 Total Fixed-Route Ridership ........................................................................................... 4-12Figure 4-3 Change in Demand Response Trip Volume .................................................................... 4-21Figure 4-4 Total PSTA Ridership FY1993/94 – 2008/09 .................................................................. 4-24Figure 4-5 Passenger Trips .............................................................................................................. 4-32Figure 4-6 Revenue Miles ................................................................................................................ 4-32Figure 4-7 Revenue Hours ............................................................................................................... 4-32Figure 4-8 Operating Expense ......................................................................................................... 4-32Figure 4-9 Vehicle Miles Per Capita ................................................................................................. 4-33Figure 4-10 Passenger Trips per Revenue Mile ................................................................................. 4-33Figure 4-11 Passenger Trips per Revenue Hour ................................................................................ 4-33Figure 4-12 Revenue Miles Between Failures .................................................................................... 4-33Figure 4-13 Operating Expense per Passenger Trip .......................................................................... 4-34Figure 4-14 Operating Expense per Revenue Mile ............................................................................ 4-34Tindale-Oliver & Associates, Inc.Pinellas Suncoast Transit AuthoritySeptember 2010 iv Transit Development Plan
Figure 4-15 Operating Expense per Revenue Hours ......................................................................... 4-35Figure 4-16 Farebox Recovery (%) .................................................................................................... 4-35Figure 5-1 Reason for Using Medicaid Bus Pass ............................................................................. 5-11Figure 5-2 Bus Stop Access Mode ................................................................................................... 5-12Figure 5-3 How would you travel if you did not have a bus pass? .................................................... 5-13Figure 5-4 How many days a week do you use your bus pass? ....................................................... 5-13Figure 5-5 Ability to Travel Throughout County ................................................................................ 5-14Figure 5-6 PSTA Service Satisfaction Ratings ................................................................................. 5-15Figure 5-7 Preferred Service Improvements ..................................................................................... 5-16Figure 5-8 Number of Working Hours per Week .............................................................................. 5-16Figure 5-9 Medicaid Bus Pass User and PSTA Bus Rider Demographics Comparison ................... 5-18Figure 5-10 Sample Index Card Illustrating Rank-Order Voting Process............................................ 5-23Figure 6-1 PSTA Conceptual Shelter Designs ................................................................................. 6-2Figure 7-1 Revenue-Constrained Plan – Operating Costs and Revenues ....................................... 7-4Figure 7-2 Revenue-Constrained Plan – Capital Costs and Revenues ............................................ 7-4Figure 7-3 Revenue-Constrained Plan – Combined Operating and Capital Costs and Revenues ... 7-5Figure 7-4 Vision Plan – Operating Costs and Revenues (FY 2010/11 – FY 2019/20) .................... 7-9Figure 7-5 Vision Plan – Capital Costs and Revenues (FY 2010/11 – FY 2019/20) ......................... 7-9Figure 7-6 Vision Plan – Combined Operating and Capital Costs andRevenues (FY 2010/11 – FY 2019/20) ............................................................................ 7-10Figure 7-7 25-Year Vision Plan – Operating Costs and Revenues ................................................... 7-21Figure 7-8 25-Year Vision Plan – Capital Costs and Revenues ....................................................... 7-21Figure 7-9 25-Year Vision Plan – Combined Operating and Capital Costs and Revenues .............. 7-22Tindale-Oliver & Associates, Inc.Pinellas Suncoast Transit AuthoritySeptember 2010 v Transit Development Plan
SECTION 1INTRODUCTIONThe Ten-Year Transit Development Plan (TDP) is the strategic guide for public transportation in PinellasCounty over the next ten years. The TDP includes a review of transit planning and policy documents, adocumentation of study area conditions and demographic characteristics, an evaluation of existing PSTAservices, a summary of market research and public involvement efforts, the development of a situationappraisal and needs assessment, and the preparation of a ten-year transit development plan and a twentyfiveyear vision plan.This TDP update effort varies from previous TDP efforts performed by PSTA in that it reflects PSTA’scommitment to becoming the mobility manager for the county. Mobility management is a strategicapproach to service coordination and customer service which involves creating partnerships withtransportation providers in a community. As described by the American Public Transportation Association(APTA), “the expectation is that transit agencies should move beyond the traditional role as operators offixed-route service and assume a broader role in coordinating the full range of mobility services in theircommunity.” The vision plan developed for this TDP reflects the need to implement such a role for PSTAand such a role would enhance PSTA’s ability to oversee delivery of multiple modes of transportationservices, including rail, trolley, fixed-bus route, and many others, throughout the county.STATE OF FLORIDA PUBLIC TRANSIT BLOCK GRANT PROGRAMThe State of Florida Public Transit Block Grant Program was enacted by the Florida Legislature to providea stable source of funding for public transit. The Block Grant Program requires public transit serviceproviders to develop and adopt a Ten-Year TDP. The TDP must be submitted to the Florida Department ofTransportation (FDOT) District Office on or before September 1 st of each year. Major updates are dueevery five years with more substantial reporting requirements. In the interim years, the TDP takes the formTindale-Oliver & Associates, Inc.Pinellas Suncoast Transit Authority1-1 September 2010 1-2 Transit Development Plan
of a progress report, which has less intense reporting requirements. The TDP is the guiding document forthe Pinellas County Metropolitan Planning Organization (MPO) Transportation Improvement Program (TIP),as well as the FDOT Five-Year Work Program concerning public transportation in Pinellas County. TheTDP must be consistent with the approved local government comprehensive plans and the MPO LongRange Transportation Plan.This plan meets the requirement for a major TDP update in accordance with Rule Chapter 14-73, FloridaAdministrative Code (FAC).Identification of the Submitting EntityAgency: Pinellas Suncoast Transit AuthorityTelephone Number: (727) 540-1800Mailing Address: 3201 Scherer Drive, St. Petersburg, FL 33716Authorizing AgencyRepresentative: Tim Garling, Executive DirectorFor further information about this plan, please contactMr. William Steele, Director of Planning, PSTA, 3201 Scherer Drive,St. Petersburg, Florida 33716(727) 540-1802 or Fax (727) 540-1913Tindale-Oliver & Associates, Inc.Pinellas Suncoast Transit Authority1-1 September 2010 1-2 Transit Development Plan
ORGANIZATION OF REPORTIn addition to the Introduction section, the TDP includes the following sections:Section 2 – The Transit Planning and Policy Documents section includes a review of transit planningdocuments and policies and their relationship to PSTA. The summary of these documents emphasizes theissues and implications for public transportation in Pinellas County.Section 3 – A summary of Study Area Conditions and Demographic Characteristics provides thebackground information needed to understand the condition under which PSTA operates transit services inPinellas County. It also helps determine future public transportation needs in the County.Section 4 – The Existing PSTA Service Levels section quantifies PSTA operations, services anddocuments the inventory of PSTA facilities and vehicles. PSTA also is compared in terms of its systemwideeffectiveness and efficiency with other southeastern U.S. transit systems deemed as comparablepeers.Section 5 – All Market Research and Public Involvement activities conducted during the preparation ofthe TDP are documented in this section. In addition, this section summarizes PSTA’s on-going communityoutreach program, which consists of a host of public involvement activities conducted throughout the year.Section 6 – The Situation Appraisal consists of an evaluation of the impacts on PSTA service fromfindings in data, documents, and information collected. In addition, a progress report on milestones ispresented to describe how PSTA is working to address market impacts identified in previous TDP efforts.Section 7 – This section presents the 10-Year Transit Development Plan. Provided in this section aretwo financial plans: a revenue-constrained plan and a vision plan. The revenue-constrained plan providesa financial plan under the assumption that current revenue sources continue but no additional revenuesources are secured. The vision plan assumes current revenue sources, as well as a new revenue sourcewhich provides for future transit growth.Tindale-Oliver & Associates, Inc.Pinellas Suncoast Transit AuthoritySeptember 2010 1-3 Transit Development Plan
SECTION 2TRANSIT PLANNING AND POLICY DOCUMENTSA major component of the TDP Update is the review of transit policies and their relationship to PSTA. Thischapter reviews transit policies at the local, state, and federal levels of government. Various transportationplanning and programming documents are summarized, with an emphasis on issues which may haveimplications for public transportation in Pinellas County.FEDERAL PLANS AND POLICIESSAFETEA-LUThe Safe, Accountable, Flexible, and Efficient Transportation Equity Act - A Legacy for Users (SAFETEA-LU) addresses required planning processes that must be undertaken when applying federal and state fundsto transportation projects. SAFETEA-LU addresses the many challenges facing our transportation systemtoday, such as improving safety, reducing traffic congestion, improving efficiency, increasing intermodalconnectivity, and protecting the environment. SAFETEA-LU promotes more efficient and effective federalsurface transportation programs by focusing on transportation issues of national significance, while givingstate and local transportation decision-makers more flexibility for solving transportation problems in theircommunities. SAFETEA-LU continues and/or establishes numerous funding programs for transit.SAFETEA-LU reauthorization is pending and is expected to continue into 2011. At that point, the newlegislation will be evaluated for pertinence to public transportation in Pinellas County.SAFETEA-LU reauthorization will transform the nation's surface transportation policies by clearly definingthe role and specific objectives of the Federal Government in providing resources to States to carry outprograms. The new act will focus the majority of transit funding in four core categories to bring urban andrural public transit systems to a state of good repair. These four categories are Critical Asset Investment,Highway Safety Improvement, Surface Transportation, and Congestion Mitigation and Air QualityImprovement. Additionally, the act will provide specific funding to restore transit rail systems; providemobility and access to transit-dependent individuals; and plan, design, and construct new transit lines andintermodal facilities. Additional objectives will include:Create a National Transportation Strategic Plan;Improve the safety of the surface transportation network;Bring existing highway and transit facilities and equipment to a “state of good repair”;Facilitate goods movement;Improve metropolitan mobility and access;Expand rural access and interconnectivity;Lessen environmental impacts from the transportation network;Tindale-Oliver & Associates, Inc.Pinellas Suncoast Transit AuthoritySeptember 2010 2-1 Transit Development Plan
Improve the project delivery process by eliminating duplication in documentation and procedures;Facilitate private investment in the national transportation system that furthers the public interest;Ensure that States receive a fair rate of return on their contributions to the Trust Fund;Provide transportation choices; andImprove the sustainability and livability of communities.Clean Air Act of 1990The Clean Air Act of 1990 and subsequent amendments determine the National Ambient Air QualityStandards (NAAQS). NAAQS are standards based on the amount of particulate matter in the air, measuredin parts per million for the following pollutants:Carbon Monoxide (CO);Nitrogen Dioxide (NO2);Ozone (O3);Sulfur Dioxide (SO2);Lead (Pb); andParticulate Matter (PM).On January 6, 2010, EPA proposed revisions to the National Ambient Air Quality Standards (NAAQS) forground-level ozone. The standards are based on scientific evidence about ozone and its effects on people,sensitive trees, and plants. The proposed revisions would affect two types of ozone standards. The firststandard affected deals with protection of public health, including the health of at-risk populations such aschildren, people with asthma, and older adults. The secondary standard affected by revisions deals withprotection of public welfare and the environment, including sensitive vegetation and ecosystems.Specifically, the EPA proposes to revise the existing ozone standards and update the Air Quality Index(AQI) for ozone.An area meeting NAAQS standards is classified as an “attainment area.” According to the previous AirQuality Technical Report in 2004, Pinellas County falls in this category as an “attainment/maintenance”area for all NAAQS pollutants. However, the stricter standards resulting from the implementation ofNAAQS revisions will cause a greater amount of locations to be classified as “non-attainment areas.” Inorder to receive transportation funding, Pinellas County must meet Federal ozone standards. EPA plans toissue final standards by October 31, 2010. At that time, Pinellas County may need to increase ozonereductionefforts. The implications of this act are increasingly higher capital and infrastructure costs fortransit vehicles and equipment to meet increasingly stringent air quality regulations.Tindale-Oliver & Associates, Inc.Pinellas Suncoast Transit AuthoritySeptember 2010 2-2 Transit Development Plan
PSTA participates in a number of environmental initiatives to assist in maintaining the “attainment area”designation. Such activities include: PSTA purchased clean diesel buses beginning in the 1990’s PSTA helped initiate and fund a regional Vanpooling and Guaranteed Ride Home Program in the1990’s 2008 model year buses use special particulate filters that cut particulate emissions (soot) by 90%over older models. PSTA uses special low-ash motor oil, which also helps reduce particulate emissions. PSTA has 10 Diesel-Electric Hybrid buses now in service and 14 more were delivered in August2010. Long before it was mandated by the government, PSTA used Ultra Low-Sulfur diesel fuel, whichalso helps reduce pollutants.On April 1, 2010, the Environmental Protection Agency (EPA) and the Department of Transportation’sNational Highway Traffic Safety Administration (NHTSA) established a program to dramatically reducegreenhouse gas emissions and improve fuel economy for new cars and trucks sold in the United States.The new standards apply to passenger cars, light-duty trucks, and medium-duty passenger vehicles,covering model years 2012 through 2016. They require these vehicles to meet an estimated combinedaverage emissions level of 250 grams of carbon dioxide per mile, equivalent to 35.5 miles per gallon (MPG)if the automobile industry were to meet this carbon dioxide level solely through fuel economyimprovements. These standards will cut greenhouse gas emissions by an estimated 960 million metrictons and 1.8 billion barrels of oil over the lifetime of the vehicles sold under the program.STATE OF FLORIDA PLANS AND POLICIESFlorida Transportation PlanThe 2025 Florida Transportation Plan (FTP) was updated and adopted in 2005. FDOT is currently in theprocess of creating the 2060 FTP Update. Instead of 20 years, the 2060 plan looks at a 50-year horizon.The 2060 plan has not yet been adopted. The 2025 Florida Transportation Plan (FTP) is Florida’sstatewide 20-year transportation plan, which provides a policy framework for allocating funding that will bespent to meet the transportation needs of the state. Florida is committed to providing livable communitiesand mobility for people and freight through greater connectivity and meeting the rising needs of businessesand households for safety, security, efficiency, and reliability. The FTP provides goals and objectives forFlorida’s transportation system. The long range goals and objectives that are pertinent to PSTA areprovided below.Tindale-Oliver & Associates, Inc.Pinellas Suncoast Transit AuthoritySeptember 2010 2-3 Transit Development Plan
Goal: Enrich quality of life and responsible environmental stewardship.oObjective: Plan, develop, implement, and fund the transportation system to accommodatethe human scale, including pedestrian, bicycle, transit-oriented, and other communityenhancingfeatures, unless inappropriate.Goal: A stronger economy through enhanced mobility for people and freight.ooooooObjective: Focus attention on meeting regional mobility needs that transcend traditionaljurisdictional boundaries and ensuring connectivity between Strategic Intermodal System(SIS), regional, and local facilities.Objective: Facilitate economic development opportunities in Florida’s economicallydistressed areas by improving transportation access from these areas to markets in amanner that reflects regional and community visions.Objective: Develop multimodal transportation systems that support community visions.Objective: Expand transportation choices to enhance local mobility and to maintain theperformance of the SIS and regionally significant facilities.Objective: Reduce per capita vehicle miles traveled by single occupancy vehicles,especially during peak hours of highway use.Objective: Ensure that the transportation system is accessible to all users, includingyoung, elderly, disabled, and economically disadvantaged persons.Goal: Sustainable transportation investments in Florida’s future.ooObjective: Reduce the cost of providing and operating transportation facilities.Objective: Document the gap between funding resources and needs across all levels andall modes in a consistent and compatible format.In summary, the FTP supports the development of state, regional, and local transit services. Future growthin Florida requires new and innovative approaches by all modes to meet the needs today and in the future.Tindale-Oliver & Associates, Inc.Pinellas Suncoast Transit AuthoritySeptember 2010 2-4 Transit Development Plan
State Growth Management Legislation (Senate Bill 360)Senate Bill 360 (SB 360), named the Community Renewal Act, was signed into law on June 1, 2009. Thepurpose of SB 360 is to direct growth into dense urban areas by removing State-mandated concurrencyrequirements within those areas. The Bill automatically designates many cities, the urban service areas ofsome counties, and some entire counties as Transportation Concurrency Exception Areas (TCEAs). Localgovernments of areas that are designated as TCEAs must understand the importance and value of a goodtransportation system and establish a clear mobility plan that addresses multimodal facilities, services, andfinancing.SB 360 created a requirement that the State “evaluate and consider” a mobility fee concept to replace theexisting transportation concurrency system. Mobility fees will not generate significant additional revenue fora community with an existing road impact fee program, nor will implementing a mobility fee solvetransportation funding in any community. Instead, mobility fee revenue will provide the flexibility to spendrevenues on more than just roads. If a community’s vision is to focus on multi-modal travel options, thenthe ability to spend “one-time payment” revenue on transit buses and infrastructure and the construction ofadditional bicycle and pedestrian facilities will help achieve that vision. As a result, the community will needa mobility fee that provides for flexibility in the way the revenues can be spent, both in terms of capitalinfrastructure and transit operations. PSTA stands to gain through implementation of a mobility fee byreceiving a greater share of funding resulting from new development.A final summary judgment rendered August 26, 2010 by a circuit court in Tallahassee, Florida, declared SB360 unconstitutional as a violation of the “unfunded mandates” provision, Article VII, § 18(a) of the FloridaConstitution. Consequently, the state legislature will be addressing the legality of SB 360 in an upcominglegislative session.Florida Hometown Democracy – Amendment 4Amendment 4 is a proposed citizen's amendment to the Florida Constitution, sponsored by FloridaHometown Democracy, a non-partisan, grass-roots group. This constitutional amendment will give Floridavoters the right to decide whether their local comprehensive land use plan should be changed. Currently,city councils and county commissions exclusively make those decisions. The measure will be placed onthe statewide ballot on November 2, 2010.The measure may have an impact on transit supportive land use amendments proposed for the PinellasCounty Future Land Use map. In addition, transit-supportive land use changes proposed by anymunicipalities in the county will also need voter approval if the amendment is passed. Transit supportivedevelopment includes increases in residential and/or commercial densities, transit-oriented development,and mixed-use zoning.Tindale-Oliver & Associates, Inc.Pinellas Suncoast Transit AuthoritySeptember 2010 2-5 Transit Development Plan
High-Speed Rail (HSR)In April 2009, the federal government unveiled a new national plan for intercity passenger rail. On January28, 2010, President Obama announced Florida was awarded $1.25 billion in American Recovery andReinvestment Act (ARRA) funds to start construction of the Tampa-Orlando leg of the federally designatedTampa-Orlando-Miami high speed rail corridor. The Tampa-Orlando line will run 84 miles from downtownTampa to Orlando International Airport and is estimated to cost $2.6 billion to build. Trains will operate atspeeds as high as 168 m.p.h.FDOT is responsible for building the project with oversight by the Federal Railroad Administration (FRA).Construction is projected to start in 2012 and system operation is scheduled for 2015.LOCAL PLANS AND POLICIES2035 Long Range Transportation Plan (LRTP)The 2035 Pinellas County LRTP is the fundamental planning document for long-range transportationsystem development in Pinellas County. The LRTP and Comprehensive Plan provide goals for the futureof the County. Although these goals are determined at the local level, they must be consistent with federalandstate-level requirements to maintain funding.The 2035 Pinellas County LRTP assesses the transportation needs of Pinellas County and sets forthimprovements necessary to meet those needs over a 25-year period. The LRTP addresses all principalmodes of transportation as an integrated system, including highways, public transportation, bikeways, andpedestrian facilities. To update the transit element of the LRTP, the MPO used information from theadopted 2025 LRTP, PSTA’s TDP, and the priorities that emerged from the Tampa Bay Area RegionalTransportation Authority (TBARTA) Regional Transportation Master Plan. A visioning and scenarioplanning process is also being used to develop and test alternative land use and transportation scenariosfor Pinellas County. The 2035 LRTP continues the MPO’s increasing emphasis on alternatives toautomobile travel, including mass transit, walking, and bicycling. Of particular relevance to PSTA, masstransit is a specific area of focus with the 2035 LRTP, as it introduces a proposed rail and premium busnetwork that takes advantage of advanced technology systems and vehicles.The LRTP has two specific objectives dedicated to public transportation. To accomplish these objectives,16 policies are provided. These policies address governmental coordination, transit-friendly design,intermodal development, and transportation disadvantaged services. Public transportation is also an areaof concern in other objectives dealing with congestion management, system management and operations,environmental protection and neighborhood preservation, safety, and intergovernmental coordination.Tindale-Oliver & Associates, Inc.Pinellas Suncoast Transit AuthoritySeptember 2010 2-6 Transit Development Plan
The LRTP objectives and policies that address public transportation are identified below. Several policiesrefer to the Pinellas Mobility Initiative (PMI) Steering Committee. That committee has been replaced by thePinellas County Alternatives Analysis Project Advisory Committee (PAC).Objective 1.4: Mass transit use shall be encouraged and promoted in order to increase ridershipwhile reducing the number of single-occupant vehicles on the county’s roadways and as a primarymeans of travel for the transportation disadvantaged population.oooooooPolicy 1.4.1: The MPO shall assist and support the efforts of the PSTA to implement andachieve the goals of its Ten-Year Transit Development Plan and to carry outrecommended actions derived from related studies.Policy 1.4.2: The MPO shall encourage local governments to include transit-friendly andsupportive design standards in local land development codes to ensure safe passage fortransit users from bus stops to proximate buildings and to encourage transit use.Policy 1.4.3: The MPO shall encourage FDOT and local governments to include pull-outbays at transit stops on major roadways in the design of road improvement projects and onre-surfacing projects, where feasible, to provide a safe boarding area for transit riderswhile limiting the impedance of oncoming vehicular traffic.Policy 1.4.4: The MPO shall continue to ensure that economically disadvantaged andphysically impaired citizens of Pinellas County have access to cost-effective and efficienttransportation services.Policy 1.4.5: In its role as the Pinellas County CTC, the MPO shall provide, whenappropriate, 31-day unlimited use PSTA bus passes (i.e., GO Cards) to TransportationDisadvantaged Program customers as a cost effective way of providing neededtransportation and increasing clients’ overall mobility.Policy 1.4.6: The MPO shall continue to work with local governments, communities, andPSTA to identify and assess transit needs in the county.Policy 1.4.7: The MPO shall work with the Tampa Bay Area Regional TransportationAuthority (TBARTA) to develop and implement a regional master plan for public transit.Tindale-Oliver & Associates, Inc.Pinellas Suncoast Transit AuthoritySeptember 2010 2-7 Transit Development Plan
ooooPolicy 1.4.8: The MPO shall continue to provide a forum for discussion of countywidetransit governance issues and will work with the County’s legislative delegation, PSTA, andthe Board of County Commissioners to implement transit governance policies.Policy 1.4.9: The MPO shall work with other governments/counties to identify projects forJobs Access/Reverse Commute (JARC) and New Freedom funding.Policy 1.4.10: The MPO shall include the public, local governments, the private sector,nonprofit agencies, and PSTA in the development of plans addressing the needs oftransportation disadvantaged populations.Policy 1.4.11: The MPO shall support/encourage provision of Americans with DisabilitiesAct (ADA)-compliant features and amenities at transit stops that accommodate the needsof persons with disabilities and the elderly.Objective 1.5: Develop a long range intra-county and regionally accessible transit system inPinellas County that features advanced technology express service to intermodal transportationfacilities, major employment centers, recreational points of interest, tourist destinations, andsignificant commercial activity.oooooPolicy 1.5.1: The MPO shall continue to prioritize funding to support the planning andimplementation activities associated with the Pinellas Mobility Initiative, which includes rail,guideway transit, expanded trolley service, bus rapid transit (BRT) strategies, and othertransportation improvements.Policy 1.5.2: The MPO shall include private sector participation in the planning andimplementation of strategies associated with the Pinellas Mobility Initiative.Policy 1.5.3: The Pinellas Mobility Initiative shall be utilized to identify and implement longtermsolutions to the mobility needs of Pinellas County residents and visitors.Policy 1.5.4: The MPO shall work with local governments to ensure that mobility strategiesand local land use plans are compatible and mutually supportive.Policy 1.5.5: The MPO shall work with the PSTA, the Board of County Commissioners,and the business community to develop a long-term funding strategy for transit.Tindale-Oliver & Associates, Inc.Pinellas Suncoast Transit AuthoritySeptember 2010 2-8 Transit Development Plan
TBARTA Regional Transportation Master PlanTBARTA was created by the state legislature on July 1, 2007, with the authority to plan and develop amultimodal transportation system that will connect the seven counties in the Tampa Bay region. PSTA, thePinellas County MPO, and FDOT District Seven worked together to develop PSTA’s component of theTBARTA Regional Transportation Master Plan, which was adopted May 22, 2009.This coordinated effort ensures consistency in methodology and system development, which in turn willcontribute to a single plan/concept that uses PSTA’s 10-year TDP as the guiding document for mid- andlong-range transit planning in Pinellas County. As TBARTA develops as a functional transportation agency,PSTA and the other transit operators in the region are actively engaged in TBARTA Board and AdvisoryCommittee meetings.Countywide Enhanced Bus Transit Network Concept PlanOn March 11, 2009, the MPO approved a concept for future premium transit services in Pinellas County.In coordination with PSTA, the Pinellas County MPO has developed a Countywide Enhanced Bus TransitNetwork Concept Plan that has identified an enhanced bus transit network within Pinellas County. ThePinellas County MPO agreed to fund a study that would explore the feasibility of enhanced bus transitservice along major arterial roadways in Pinellas County. The enhanced network will connect current andfuture transit supportive land uses in order to provide premium transit service to the major origins anddestinations within the county.The study identifies candidate corridors for the potential implementation of a combination of traditional,enhanced, and premium bus service while establishing the framework for future enhanced bus transitservice in Pinellas County. The development of this plan is a continuing effort initiated by the MPO todevelop a countywide intermodal approach to transportation that includes fixed-guideway, BRT, trolley, andenhanced bus services. The PSTA Board took formal action and approved the plan as a conceptualnetwork.Pinellas County Comprehensive PlanFlorida law requires every incorporated municipality and county to adopt a comprehensive plan that isconsistent with the Growth Management Act of 1985. The Growth Management Act requires allcomprehensive plans to be consistent with state and regional plans. For communities with a populationover 50,000, all comprehensive plans must include a Transportation Element that summarizes the existingand future transportation conditions, how those conditions relate to what the community considers the idealtransportation situation, and how the community proposes to get there. The Pinellas CountyComprehensive Plan is the primary policy document concerning land use, transportation, and otherplanning categories for the County.Tindale-Oliver & Associates, Inc.Pinellas Suncoast Transit AuthoritySeptember 2010 2-9 Transit Development Plan
According to the Transportation Element of the Comprehensive Plan, public transportation has the highestpotential of any alternative transportation mode of reducing the demand for personal motorized travel inurban areas. To allow transit service to be a more viable form of transportation in the county from thestandpoint of reducing automobile dependence, more mixed-use concentrated urban communities areneeded to support it.The implications of the Comprehensive Plan are that Pinellas County must continue to move towardproviding more effective public transportation services. It is evident that the current land use patterns anddemographics are not the ideal operating environment for public transportation. The following are theprimary goals and policies of the Comprehensive Plan’s Transportation Element relevant to publictransportation.Objective 1.2: Pinellas County, in cooperation with Pinellas Suncoast Transit Authority (PSTA), shall striveto provide transit access for all major traffic generators and attractors with headways less than or equal to30-minute headways in the peak hour and no greater than 60 minutes in the off-peak period.Policy 1.2.1: Pinellas County shall continue to work with PSTA to increase the efficiency of thefixed-route system by encouraging mass transit use through the application of the ConcurrencyManagement System, Site Plan Review Process, and the implementation of MPO corridor strategyplans.Objective 1.3: The Transportation Element shall be coordinated with the goals, objectives, and policies ofthe Future Land Use and Quality Communities Element in guiding population distribution, economic growth,and the overall pattern of urban development.Policy 1.3.7: By 2012, Pinellas County shall conduct a study of the “coastal corridor” from GulfBoulevard to the Pinellas/Pasco County Line to determine how land use and transit planning canbe coordinated to create or highlight destinations and venues so that tourists can easily go fromone community to another while experiencing the uniqueness of each.Objective 1.7: Pinellas County shall increase the efficiency and effectiveness of mass transit service aswell as opportunities for multi-passenger vehicle travel that accommodates the transportation needs of theservice area population and the transportation disadvantaged while reducing single-occupant vehicledemand.Policy 1.7.1: Pinellas County shall participate in the MPO-sponsored Pinellas Mobility Initiative(PMI) in the effort to identify and develop long-term mobility solutions in Pinellas County.Tindale-Oliver & Associates, Inc.Pinellas Suncoast Transit AuthoritySeptember 2010 2-10 Transit Development Plan
Policy 1.7.2: Pinellas County shall consider PMI recommendations regarding implementation ofmass transit initiatives for amendments to the Transportation Element as necessary.Policy 1.7.3: Pinellas County shall participate in MPO-sponsored corridor strategy plans, compilingand analyzing information on existing land uses, future land use plans, existing traffic patterns andbus stop and sidewalk locations to determine where opportunities exist to implement strategies toencourage mass transit ridership as well as other alternative modes of travel.Policy 1.7.4: Pinellas County shall facilitate the provision of bus stop improvements and pulloutbays along major roadways through the application of the Concurrency Management System.Policy 1.7.5: Pinellas County shall continue to identify and monitor “unmet” transportationdisadvantaged needs within unincorporated Pinellas County. Residents in need of transportationassistance shall be informed of services available through the Pinellas County TransportationDisadvantaged Program.Policy 1.7.8: Pinellas County shall pursue JARC and New Freedom grant monies underSAFETEA-LU to fund transportation services to disadvantaged citizens.Policy 1.7.9: Pinellas County shall continue to maintain an inventory of transportationdisadvantaged persons that would be affected by an evacuation order in the event of a naturaldisaster. Those needing to evacuate to a public shelter who have no personal means available totransport them, shall be provided the opportunity to register with Pinellas County for Special Needsassistance in order to receive transportation assistance.Policy 1.7.10: In 2009, Pinellas County shall amend the Land Development Code to implementlivable community improvements that will require and/or encourage developments to provideseparated/buffered pedestrian ways (e.g., sidewalks, crosswalks) connecting bus stops toproximate buildings.Policy 1.7.11: Pinellas County shall coordinate with PSTA to identify locations where the need forpedestrian accommodations between bus stops and the sidewalk network is most pronouncedfrom a safety standpoint.Policy 1.7.12: Pinellas County shall work with PSTA to pursue Transportation Regional IncentiveProgram (TRIP) funding as appropriate to assist in funding transit improvements necessary toaddress growth management issues in the region.Tindale-Oliver & Associates, Inc.Pinellas Suncoast Transit AuthoritySeptember 2010 2-11 Transit Development Plan
were appointed to the PAC by the PSTA and MPO governing boards and TBARTA. The first PAC meetingwas on June 30 th , 2010. The PAC will continue to meet on a monthly basis. Members include:Commissioner Harriet Crozier (Pinellas MPO)Commissioner Karen Seel (Pinellas MPO)Mayor R.B. Johnson (PSTA)Commissioner Kenneth Welch (PSTA)Councilmember Jeffery Danner (TBARTA)Mayor Frank Hibbard (TBARTA)Secretary Donald Skelton (FDOT)Gateway Regional Multimodal Transportation District Pilot Project and Largo Multi-modalTransportation District (MMTD)There are currently two MMTD efforts underway in the county, one for the Gateway area and one for theCity of Largo. The goals of an MMTD include mitigating the impact to the Strategic Intermodal System(SIS), providing for a mix of modes, shifting automobile trips to other modes, and expanding the mix of landuses within the district. The purpose of the Gateway MMTD Pilot Project is to provide a report identifyingthe challenges and benefits of the regional MMTD to the State Legislature. The City of Largo is in theprocess of prioritizing multi-modal projects and identifying revenue sources for funding those projects.The City of Largo MMTD will serve as a good example for other similar efforts throughout the county. TheGateway area is considered by many in the county as the most ideal target area for implementing land usepolicies, such as an MMTD, that fuel the economic growth of the county. Because of its geographiclocation, the area serves as a nexus between Pinellas and Hillsborough counties and many of the largestemployers throughout Pinellas County are concentrated there. In addition, its unique geography makes thearea an ideal candidate for convening regional and local public transportation services. As noted by theUrban Land Institute (ULI), compact development and metropolitan intensification that is regionallyintegrated with transit systems will benefit not only Florida’s economy, but also the State’s environment andquality of life. Furthermore, the ULI states that clustering development around transit stations or stopsimproves the efficiency of the transit system, allowing for higher quality service, which, with supportingplanning and development policies, increases property values. As the “gateway” into Pinellas County, theGateway area can serve the dual purpose of economic generator for the county and as the major hub fortransit activity in the region.SUMMARYThe purpose of this chapter was to review related transportation planning and programming documents toassess existing transit policies, along with their relationship to PSTA. Policies were reviewed at the local,Tindale-Oliver & Associates, Inc.Pinellas Suncoast Transit AuthoritySeptember 2010 2-13 Transit Development Plan
state, and federal levels of government to determine guidance for the subsequent development of the TDPUpdate. The review of local, state, and federal transportation policies indicates that no conflicts areexpected with regard to consistency with other plans and programs.Federal policies emphasize lessening the environmental impacts of the transportation sector andencouraging integration of efficient vehicle types into the transportation sector. State of Florida policiesemphasize funding to ensure good quality of life and environmental stewardship. State policies alsoencourage expanding choices, enhancing local mobility, reducing vehicle miles traveled, increased multimodaltravel, and enhancing sustainability through reduced transportation costs and increased fundingpartnerships. Local plans emphasize reducing travel by single-occupant vehicles through increasing multimodaland intermodal transportation options, increasing intergovernmental coordination, and supportingPSTA in carrying out TDP proposals.Tindale-Oliver & Associates, Inc.Pinellas Suncoast Transit AuthoritySeptember 2010 2-14 Transit Development Plan
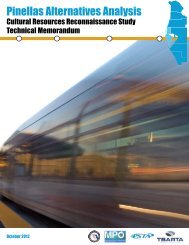
SECTION 3STUDY AREA CONDITIONS AND DEMOGRAPHIC CHARACTERISTICSThis section summarizes the existing conditions and demographic characteristics within PSTA’s servicearea in Pinellas County. A service area description, demographic characteristics, land use information,commuting patterns data, and roadway conditions are included. The highlights of the review aresummarized at the end of the chapter. This review provides the background information needed tounderstand PSTA’s operating environment and the characteristics of the service area population.SERVICE AREA DESCRIPTIONLocated on the West Coast of Florida approximately 10 miles west of the City of Tampa, Pinellas County isan urban county with the highest population density in the state of Florida. Pinellas County is composed of24 municipalities, the largest of which are the cities of St. Petersburg and Clearwater. Roughly 280,000people reside in the unincorporated area of Pinellas County, which represents the 36 percent of thecounty’s total population. According to the 2000 Census, the county has a total area of 608 square miles,with 280 square miles of land and 328 square miles of water. Map 3-1 illustrates the municipalities andunincorporated areas of Pinellas County.To better understand the study area conditions and demographic characteristics of Pinellas County, areview of pertinent information was conducted as part of the TDP update process. The sources for thisinformation include the U.S. Census Bureau, the American Community Survey (ACS), the Bureau ofEconomic and Business Research at the University of Florida (BEBR), FDOT, the Pinellas County MPO,and the Tampa Bay Regional Planning Council (TBRPC), and PSTA.DEMOGRAPHIC INFORMATIONBelow is a summary of demographic information that includes population characteristics varying from ageto employment status and types.PopulationThe estimated population of Pinellas County was 938,461 in 2008. From 2000 to 2006, the annualpopulation growth was less than one percent. Interestingly, the county population has been graduallydecreasing since 2006 from 948,102 to 938,461 in 2008. Table 3-1 presents the estimated population foryear 2000 and 2008 by municipality. From 2000 to 2008, South Pasadena experienced the highestpopulation loss at 7.55 percent while Seminole had a population gain of 73.2 percent.Tindale-Oliver & Associates, Inc.Pinellas Suncoast Transit AuthoritySeptember 2010 3-1 Transit Development Plan
EAST LAKE DRBELCHER RDUS 19ACR 39SR 58062ND ST N66TH ST N49TH ST NBELCHER RD22ND AVE NMap 3-2:9TH AVE NAbsolute PopulationGrowth by TAZ(2010 to 2020)4TH AVE N5TH AVE NCENTRAL AVE1ST AVE S1ST AVE N5TH AVE S28TH ST S11TH AVE S64TH ST S18TH AVE S34TH ST S49TH ST SPASADENA AVE S14TH AVE S26TH AVE SLEGEND58TH ST SBLIND PASS RDPSTA Bus RoutesLocal Routes54TH AVE SCommuter Routes4TH ST S31ST ST SPINELLAS BAYWAY SGULF BLVDPASS A GRILLE WAYExpress RoutesPINELLAS POINT DR SPopulation GrowthNo Change1 - 5PINELLAS BAYWAY6 - 1011 - 25> 25SUNSHINE SKYWAY´Hillsborough CoSource: Pinellas County MPO2 1 0 2MilesI-275GANDY BLVDManatee Cou62NDAVE NEANCLOTE RDE LIVE OAK STKEYSTONE RDEAST LAKE RDGULF RD E TARPON AVEMERES BLVDE KLOSTERMAN RDBAY STLANSBROOK PKWYALDERMAN RDNEBRASKA AVECR 611CR 1CURLEW RDTAMPA RDSOLON AVEBAYSHORE BLVDSHORE DR EMAIN STPHILLIPPE PKWYUS HIGHWAY 19 NDREW STDRUID RDBELLEAIR RDSTARKEY RD113TH ST NSEMINOLE BLVD102ND AVE NPARK BLVD N4TH ST N54TH AVE N62ND AVE N34TH ST N28TH ST NMCMULLEN BOOTH RDVIRGINIA STUNION STSUNSET POINT RDDOUGLAS AVEEAST BAY DRSR 590BAYSIDE BRIDGELAKEVIEW RD8TH AVE SW150TH AVE NINDIAN ROCKS RDULMERTON RD126TH AVE NWALSINGHAM RD 118TH AVE N131ST ST N125TH ST N60TH ST N16TH ST N1ST ST NDR MARTIN LUTHER KING JR ST NN BETTY LNISLAND WAYMANDALAY AVECOURTNEY CAMPBELL CSWYCOURT STN FT HARRISON AVEWYATT ST38TH AVE N30TH AVE NPinellas Suncoast Transit AuthorityTransit Development PlanFY 2011 - FY 2020I-275OAKLEAF BLVDNORTHSIDE DRSR 580SR 5909TH AVE NROSERY RD NEWHITNEY RDROOSEVELT BLVD142ND AVE NDRYER AVE 16TH AVE SEWILCOX RDROOSEVELT BLVDHAMLIN BLVD86TH AVE N82ND AVE N16TH ST N70TH AVE N19TH ST N46TH AVE N71ST ST NPARK ST NDUHME RD58TH ST NTYRONE BLVD NGULF BLVD
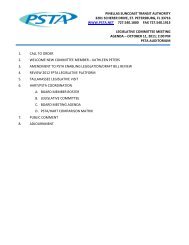
ANCLOTE RDUS 19ABELCHER RDPASS A GRILLE WAYBELCHER RD66TH ST N49TH ST N28TH ST SBAY ST NEANCLOTE RDUS 19ABELCHER RDPASS A GRILLE WAYBELCHER RD66TH ST N49TH ST N28TH ST SBAY ST NEEAST LAKE DREAST LAKE DRE LIVE OAK STE LIVE OAK STGULF RD E TARPON AVEMERES BLVDBAY STE KLOSTERMAN RDEAST LAKE RDLANSBROOK PKWYKEYSTONE RDGULF RD E TARPON AVEMERES BLVDBAY STE KLOSTERMAN RDEAST LAKE RDLANSBROOK PKWYKEYSTONE RDALDERMAN RDLAKE FRONT DRPinellas Suncoast Transit AuthorityALDERMAN RDLAKE FRONT DRGULF BLVDMANDALAY AVEISLAND WAYINDIAN ROCKS RDDOUGLAS AVEBAYSHORE BLVDN BETTY LNCOURT STCR 1VIRGINIA STUNION STDREW STDRUID RDMAIN STSUNSET POINT RDLAKEVIEW RDNEBRASKA AVEBELLEAIR RDCR 39ROSERY RD NEEAST BAY DRUS HIGHWAY 19 NSR 580CURLEW RDSR 590MCMULLEN BOOTH RD8TH AVE SW150TH AVE NDRYER AVES FT HARRISON AVE16TH AVE SESOLON AVENORTHSIDE DR142ND AVE NWHITNEY RDCR 611BAYSIDE BRIDGEROOSEVELT BLVD9TH AVE NPHILLIPPE PKWYOAKLEAF BLVDSR 590TAMPA RDSHORE DR ESR 580COURTNEY CAMPBELL CSWYI-275I-275Transit Development PlanFY 2011 - FY 2020GULF BLVDMANDALAY AVEISLAND WAYINDIAN ROCKS RDCR 1DREW STSOLON AVEMAIN STVIRGINIA STUNION STSUNSET POINT RDDRUID RDLAKEVIEW RDBELLEAIR RDROSERY RD NEEAST BAY DRUS HIGHWAY 19 NSR 580CURLEW RDSR 590MCMULLEN BOOTH RD9TH AVE N8TH AVE SW150TH AVE NDRYER AVES FT HARRISON AVEDOUGLAS AVEBAYSHORE BLVDN BETTY LNCOURT ST16TH AVE SENEBRASKA AVECR 39NORTHSIDE DR142ND AVE NWHITNEY RDCR 611BAYSIDE BRIDGEROOSEVELT BLVDPHILLIPPE PKWYOAKLEAF BLVDSR 590TAMPA RDSHORE DR ESR 580COURTNEY CAMPBELL CSWYI-275I-275´HAMLIN BLVD2 1 0 2MilesWILCOX RDWALSINGHAM RD102NDAVE N131ST ST N125TH ST N113TH ST NSEMINOLE BLVD70TH AVE NDUHME RD150TH AVESTARKEY RD86TH AVE NPARK ST NBLIND PASS RDBRYAN DAIRY RD71ST ST NTYRONE BLVD NPASADENA AVE SGULF BLVD60TH ST NPARK BLVD N46TH AVE N64TH ST S54TH AVE N58TH ST NPINELLAS BAYWAY82ND AVE N1ST AVE N58TH ST S126TH AVE N118TH AVE N62ND AVE N38TH AVE N9TH AVE N11TH AVE S49TH ST SPINELLAS BAYWAY SULMERTON RD34TH ST N30TH AVE N22ND AVE N1ST AVE S34TH ST S28TH ST N5TH AVE N31ST ST SSUNSHINE SKYWAYROOSEVELT BLVD19TH ST N16TH ST N16TH ST NDR MARTIN LUTHER KING JR ST NI-3754TH ST NCENTRAL AVE18TH AVE S26TH AVE S54TH AVE S1ST ST N5TH AVE S14TH AVE S6TH ST S4TH ST SPINELLAS POINT DR S83RD AVE NE62ND AVE NEGANDY BLVDHillsborough >5,000 CountyPopulation Densityby TAZ(2010 and 2020)LEGENDMap 3-3:PSTA Bus RoutesLocal RoutesCommuter RoutesExpress RoutesPeople Per Square Mile
AgeAn important trend in Pinellas County is the aging of the population. The trend is important because thepopulation of Pinellas County has been getting older over the past 20 years. This may be attributed to thelarge number of “baby-boomers” residing in Pinellas County, as well as the significant retirementpopulation. Figure 3-1 shows the median age of Pinellas County from 1990 to 2000, as well as median ageprojections through 2020. The median age has increased by over nine percent from 1990 to 2010.Figure 3-1Median Age50.0Age48.046.044.042.040.048.148.246.045.944.243.042.01970 1980 1990 2000 2005 2010 2020YearSources: Florida Statistical Abstract, 2009, Bureau of Economic and Business Research, University of Florida and the American Community Survey of the U.S.Census.Household SizeIn addition to having the highest population density in Florida, Pinellas County is one of two counties thathave the smallest average household size. According to BEBR, the 2008 estimated average householdsize is 2.15 persons, placing Pinellas County with Sarasota County as having the smallest averagehousehold size in the state.Minority PopulationPinellas County’s population shows that there is a lower proportion of minorities when compared to Floridaand the nation as a whole. According to the 2008 ACS, over 80 percent of the county population is white,nearly 10 percent is African-American, less than 3 percent is Asian, and slightly more than 3 percent is ofanother race or two or more races. Nearly 7 percent of the population is of Hispanic origin.IncomeAccording to the 2008 ACS, the estimated 2008 median household income for Pinellas County is $45,895.This represents a 24-percent increase since 2000. The 2000 Census data show that median householdincome in the county was $37,111, an increase of 41 percent since 1990. Approximately 10.4 percent ofthe county population has an annual household income below the poverty line in 2008.Tindale-Oliver & Associates, Inc.Pinellas Suncoast Transit AuthoritySeptember 2010 3-6 Transit Development Plan
Auto OwnershipBased on the 2000 Census, over 9 percent of the occupied dwelling units in Pinellas County did not have avehicle available for use. Households with no vehicles are considered a primary market for publictransportation services. In most cases, persons living in occupied dwelling units had access to more thanone automobile. Table 3-2 shows the primary means of travel to work for Pinellas County residents.Census and ACS data show that automobiles are the overwhelming choice for travel. According to the2000 Census, over 90 percent of workers over age 16 use their personal automobile to drive to work, withnearly 80 percent driving alone. It is important to note that the transit mode split increased from 1.5 percentin 1990 to 1.9 percent in 2000, an increase of 27 percent. However, according to 2008 ACS data, singleoccupancy vehicle travel has decreased only 0.1 percent, while the carpool, walking, and transit modeshares have all decreased between 2000 and 2008. Work at Home has seen the most significant increasefrom 1990 to 2008.Table 3-2Means of Transportation to WorkMode Preference 1990 2000 2008% Change1990-2000% Change2000-2008Drive Alone 78.9% 79.7 % 79.6% 1.0% -0.1%Carpool 12.5% 11.0% 9.2% -12.0% -16.4%Walk 2.4% 2.0% 1.7% -16.7% -15.0%Public Transportation 1.5% 1.9% 1.6% 26.7% -15.8%Work at Home 2.5% 3.5% 5.0% 40.0% 42.9%Other Means 2.2% 1.8% 2.9% -18.2% 61.1%Sources: 1990 and 2000 Census, and 2008 ACS.EmploymentUnemployment rates in the county have been on the rise since 2000. In 2000, the unemployment rate was2.5 percent. Due to the economic recession beginning in 2007, the unemployment rate in 2009 reached10.8 percent. This trend is consistent with the unemployment rates of adjacent counties and the nation asa whole. As of July 2010, the Florida Agency for Workforce Innovation indicated that the unemploymentrate had increased to 11.8 percent in Pinellas County. That unemployment rate is higher than thestatewide average for Florida (11.5%).The economy in Pinellas County is primarily service-oriented, with over 45 percent of employment fallingwithin this category in 2002. Although service jobs have seemed to level off more recently, according to thePinellas County MPO 2035 LRTP, it was projected that approximately 60 percent of the jobs in the countywill be in the service industry in 2035.Other major industries include medical and biotechnology products, plastics, navigational instruments,electronic equipment, printing and publishing equipment, and industrial machinery. Table 3-3 shows theemployment breakdown by major employment category for Pinellas County in 2008. The table also showsTindale-Oliver & Associates, Inc.Pinellas Suncoast Transit AuthoritySeptember 2010 3-7 Transit Development Plan
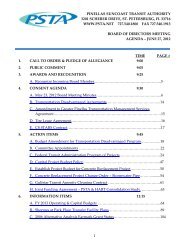
the percent change by employment category from 2002 to 2008. The most notable increase (11.6%) lies inthe job category of “Mining, Construction, and Utilities,” followed by the “Professional” category.“Agriculture, Forestry, and Fishing” experienced the highest job loss, 65.7 percent.CategoryTable 3-3Employment by CategoryEmployees% in 2008 % in 2002In 2008% Change2002-2008Agriculture, Forestry, and Fishing 134 0.03% 0.1 % -65.72%Mining, Construction, and Utilities 25,732 6.6% 5.9% 11.59%Wholesale, Transportation, Warehousing, andManufacturing57,815 14.8% 14.9% -0.72%Retail 52,484 13.4% 13.3% 0.96%Professional 79,947 20.5% 19.1% 7.09%Services 174,380 44.6% 46.7% -4.46%Other 353 0.1% 0.1% -9.68%Source: Florida Statistical Abstract, 2000 & 2009; Bureau of Economic and Business Research, University of Florida.Note: The professional category includes information, finance, insurance, real estate, professional services, scientific services, technical services, andmanagement and enterprise. Services include administration and support, educational services, healthcare and social assistance, arts entertainment andrecreation, accommodation and food services, and other services.The majority of employment growth is expected to occur in the Greater Pinellas Park area, the Greater St.Petersburg area, the Highpoint and Windward Pointe area, the Greater Clearwater area, the Worthingtonarea, and the Tarpon Springs Area. In addition, redevelopment is expected to occur in the urban areas ofthe county, especially in the cities of St. Petersburg and Clearwater. Map 3-4 shows projected absoluteemployment growth by TAZ from 2010 to 2020 and Map 3-5 shows employment density by TAZ for 2010and 2020 in Pinellas County. Areas forecasted to experience growth in employment density includeGateway, Tarpon Springs, and various locations in Largo, among others. Table 3-4 lists major employersin the county and Map 3-6 shows the location of each major employer listed in Table 3-4.Tindale-Oliver & Associates, Inc.Pinellas Suncoast Transit AuthoritySeptember 2010 3-8 Transit Development Plan
Table 3-4Major Private and Public Employers in Pinellas CountyEmployerNAICS DescriptionNumberEmployedMajor Private EmployersFidelity InformationServiceData Processing & Related Services 4,000Home ShoppingNetworkTelevision Broadcasting 4,000Nielsen MediaResearchAll Other Publishers 3,000Tech Data Corp. Computer & Software Merchant 2,500Special DataProcessing, Inc.Jabil CircuitOther Direct Selling Establishments 1,800Bare Printed Circuit BoardManufacturing1,700Western Reserve LifeAssuranceInsurance Agencies & Brokerages 1,500Ceridian BenefitsServices, Inc.Pension Funds 1,200Franklin TempletonCompaniesFinancial Investment 1,200Cox Target Media, Inc. Direct Mail Advertising 1,001Danka Office Imaging Broadcast & WirelessCo.Communications Equipment1,001FACS Group, Inc.Financial Transaction Processing &Clearing1,000Major Public EmployersPinellas County SchoolBoardSchool District 13,905Board of PinellasCountyExecutive Offices 4,000City of St. Petersburg Executive Offices 3,500Pinellas CountySheriff’s OfficeBay Pines VA MedicalCenterSource: Pinellas County Economic Development.Sheriff’s Office 2,800Medical Center 2,330Location11601 Roosevelt Blvd NSt. Petersburg, FL 337161 HSN DrSt. Petersburg, FL 33729501 Brooker Creek BlvdOldsmar, FL 346775350 Tech Data DrClearwater, Fl 3376016120 US Highway 19 NClearwater, Fl 3376410560 Dr. Martin Luther King Jr. St NSt. Petersburg, FL 33716570 Carillon PkwySt. Petersburg, FL 337163201 34 th St SSt. Petersburg, FL 33711100 Fountain ParkwaySt. Petersburg, FL 337168605 Largo Lakes DrLargo, FL 3377311101 Roosevelt Blvd NSt. Petersburg, FL 3371613141 34 th St NClearwater, FL 33762301 4th St. SWLargo, FL 33779315 Court St.Clearwater, FL 34616175 5 th St. NSt. Petersburg, FL 3370110750 Ulmerton RdLargo, FL 3377810000 Bay Pines BlvdBay Pines, FL 33744Tindale-Oliver & Associates, Inc.Pinellas Suncoast Transit AuthoritySeptember 2010 3-9 Transit Development Plan
EAST LAKE DRBELCHER RDUS 19ACR 39SR 58062ND ST N66TH ST N49TH ST NBELCHER RD22ND AVE NMap 3-4:9TH AVE N5TH AVE NAbsolute EmploymentGrowth by TAZ(2010 to 2020)4TH AVE NCENTRAL AVE1ST AVE S1ST AVE N5TH AVE S28TH ST S11TH AVE S64TH ST S18TH AVE S34TH ST S49TH ST SPASADENA AVE S14TH AVE S26TH AVE SLEGEND58TH ST SBLIND PASS RDPSTA Bus RoutesLocal Routes54TH AVE SCommuter Routes4TH ST S31ST ST SPINELLAS BAYWAY SGULF BLVDPASS A GRILLE WAYExpress RoutesPINELLAS POINT DR SEmployment Growth01 - 10PINELLAS BAYWAY11 - 2021 - 50>50SUNSHINE SKYWAY´Hillsborough CoSource: Pinellas County MPO2 1 0 2MilesI-275GANDY BLVDManatee Cou62NDAVE NEANCLOTE RDE LIVE OAK STKEYSTONE RDEAST LAKE RDGULF RD E TARPON AVEMERES BLVDE KLOSTERMAN RDBAY STLANSBROOK PKWYALDERMAN RDNEBRASKA AVECR 611CR 1CURLEW RDTAMPA RDSOLON AVEBAYSHORE BLVDSHORE DR EMAIN STPHILLIPPE PKWYUS HIGHWAY 19 NDREW STDRUID RDBELLEAIR RDSTARKEY RD113TH ST NSEMINOLE BLVD102ND AVE NPARK BLVD N4TH ST N54TH AVE N62ND AVE N34TH ST N28TH ST NMCMULLEN BOOTH RDVIRGINIA STUNION STSUNSET POINT RDDOUGLAS AVEEAST BAY DRSR 590BAYSIDE BRIDGELAKEVIEW RD8TH AVE SW150TH AVE NINDIAN ROCKS RDULMERTON RD126TH AVE NWALSINGHAM RD 118TH AVE N131ST ST N125TH ST N60TH ST N16TH ST N1ST ST NDR MARTIN LUTHER KING JR ST NN BETTY LNISLAND WAYMANDALAY AVECOURTNEY CAMPBELL CSWYCOURT STN FT HARRISON AVEWYATT ST38TH AVE N30TH AVE NPinellas Suncoast Transit AuthorityTransit Development PlanFY 2011 - FY 2020I-275OAKLEAF BLVDNORTHSIDE DRSR 580SR 5909TH AVE NROSERY RD NEWHITNEY RDROOSEVELT BLVD142ND AVE NDRYER AVE 16TH AVE SEWILCOX RDROOSEVELT BLVDHAMLIN BLVD86TH AVE N82ND AVE N16TH ST N70TH AVE N19TH ST N46TH AVE N71ST ST NPARK ST NDUHME RD58TH ST NTYRONE BLVD NGULF BLVD
ANCLOTE RDUS 19ABELCHER RDPASS A GRILLE WAYBELCHER RD66TH ST N49TH ST N28TH ST SBAY ST NEANCLOTE RDUS 19ABELCHER RDPASS A GRILLE WAYBELCHER RD66TH ST N49TH ST N28TH ST SBAY ST NEEAST LAKE DREAST LAKE DRE LIVE OAK STE LIVE OAK STGULF RD E TARPON AVEMERES BLVDBAY STE KLOSTERMAN RDEAST LAKE RDLANSBROOK PKWYKEYSTONE RDGULF RD E TARPON AVEMERES BLVDBAY STE KLOSTERMAN RDEAST LAKE RDLANSBROOK PKWYKEYSTONE RDALDERMAN RDLAKE FRONT DRPinellas Suncoast Transit AuthorityALDERMAN RDLAKE FRONT DRGULF BLVDMANDALAY AVEISLAND WAYINDIAN ROCKS RDDOUGLAS AVEBAYSHORE BLVDN BETTY LNCOURT STCR 1VIRGINIA STUNION STDREW STDRUID RDMAIN STSUNSET POINT RDLAKEVIEW RDNEBRASKA AVEBELLEAIR RDCR 39ROSERY RD NEEAST BAY DRUS HIGHWAY 19 NSR 580CURLEW RDSR 590MCMULLEN BOOTH RD8TH AVE SW150TH AVE NDRYER AVES FT HARRISON AVE16TH AVE SESOLON AVENORTHSIDE DR142ND AVE NWHITNEY RDCR 611BAYSIDE BRIDGEROOSEVELT BLVD9TH AVE NPHILLIPPE PKWYOAKLEAF BLVDSR 590TAMPA RDSHORE DR ESR 580COURTNEY CAMPBELL CSWYI-275I-275Transit Development PlanFY 2011 - FY 2020GULF BLVDMANDALAY AVEISLAND WAYINDIAN ROCKS RDCR 1DREW STSOLON AVEMAIN STVIRGINIA STUNION STSUNSET POINT RDDRUID RDLAKEVIEW RDBELLEAIR RDROSERY RD NEEAST BAY DRUS HIGHWAY 19 NSR 580CURLEW RDSR 590MCMULLEN BOOTH RD9TH AVE N8TH AVE SW150TH AVE NDRYER AVES FT HARRISON AVEDOUGLAS AVEBAYSHORE BLVDN BETTY LNCOURT ST16TH AVE SENEBRASKA AVECR 39NORTHSIDE DR142ND AVE NWHITNEY RDCR 611BAYSIDE BRIDGEROOSEVELT BLVDPHILLIPPE PKWYOAKLEAF BLVDSR 590TAMPA RDSHORE DR ESR 580COURTNEY CAMPBELL CSWYI-275I-275´HAMLIN BLVD2 1 0 2MilesWILCOX RDWALSINGHAM RD102NDAVE N131ST ST N125TH ST N113TH ST NSEMINOLE BLVD70TH AVE NDUHME RD150TH AVESTARKEY RD86TH AVE NPARK ST NBLIND PASS RDBRYAN DAIRY RD71ST ST NTYRONE BLVD NPASADENA AVE SGULF BLVD60TH ST NPARK BLVD N46TH AVE N64TH ST S54TH AVE N58TH ST NPINELLAS BAYWAY82ND AVE N1ST AVE N58TH ST S126TH AVE N118TH AVE N62ND AVE N38TH AVE N9TH AVE N11TH AVE S49TH ST SPINELLAS BAYWAY SULMERTON RD34TH ST N30TH AVE N22ND AVE N1ST AVE S34TH ST S28TH ST N5TH AVE N31ST ST SSUNSHINE SKYWAYROOSEVELT BLVD19TH ST N16TH ST N16TH ST NDR MARTIN LUTHER KING JR ST NI-3754TH ST NCENTRAL AVE18TH AVE S26TH AVE S54TH AVE S1ST ST N5TH AVE S14TH AVE S6TH ST S4TH ST SPINELLAS POINT DR S83RD AVE NE62ND AVE NEGANDY BLVDHillsborough >6000 CountyMap 3-5:Employment Densityby TAZ(2010 and 2020)LEGENDPSTA Bus RoutesLocal RoutesCommuter RoutesExpress RoutesEmployees Per Square Mile
SUNSHINE SKYWAY54TH AVE S14TH AVE SPINELLAS POINT DR SSR 580CR 39WYATT ST") ") " ") " 126TH AVE "") " 30TH AVE N22ND AVE N9TH AVE N1ST AVE N1ST AVE S CENTRAL AVE") "5TH AVE SMap 3-6:Major Private andEmployersMajor EmployersPrivate EmployersPublic EmployersPSTA Bus RoutesLocal RoutesCommuter RoutesExpress RoutesManatee Cou") ") "") "N ") "") ")" 26TH AVE SPublic ") " ") " " ") ") "") "") "LEGEND")" ")" RtTypeSource: Pinellas County Economic Development2 1 0 2MilesHillsborough Co´PASS A GRILLE WAYPINELLAS BAYWAYGULF BLVDPINELLAS BAYWAY S31ST ST S4TH ST SBLIND PASS RD34TH ST SPASADENA AVE S58TH ST S49TH ST S18TH AVE S64TH ST S11TH AVE S28TH ST S5TH AVE N4TH AVE NTYRONE BLVD N58TH ST NDUHME RDPARK ST N38TH AVE N1ST ST N46TH AVE N54TH AVE N34TH ST N28TH ST N19TH ST N71ST ST N62ND AVE N70TH AVE N4TH ST NPARK BLVD N16TH ST N131ST ST N102ND AVE N113TH ST NSEMINOLE BLVD86TH AVE NBELCHER RD82ND AVE N60TH ST NDR MARTIN LUTHER KING JR ST N62NDAVE NE125TH ST NHAMLIN BLVDSTARKEY RD66TH ST N49TH ST NROOSEVELT BLVD16TH ST NGANDY BLVDWALSINGHAM RD 118TH AVE N62ND ST NWILCOX RDULMERTON RDDRYER AVE 16TH AVE SE142ND AVE NGULF BLVDINDIAN ROCKS RD8TH AVE SW150TH AVE NEAST BAY DRROOSEVELT BLVDI-275WHITNEY RDBAYSIDE BRIDGEI-275ROSERY RD NEBELLEAIR RDLAKEVIEW RDDRUID RDCOURT STDREW STUS HIGHWAY 19 NCOURTNEY CAMPBELL CSWYMANDALAY AVEISLAND WAYN FT HARRISON AVEN BETTY LNSR 590DOUGLAS AVESUNSET POINT RDUNION STVIRGINIA STMAIN STMCMULLEN BOOTH RD9TH AVE NPHILLIPPE PKWYSR 590SHORE DR EBAYSHORE BLVDOAKLEAF BLVDSOLON AVESR 580NORTHSIDE DRTAMPA RDCURLEW RDCR 1CR 611US 19ANEBRASKA AVEALDERMAN RDBELCHER RDTransit Development PlanFY 2011 - FY 2020LANSBROOK PKWYBAY STE KLOSTERMAN RDPinellas Suncoast Transit AuthorityMERES BLVDGULF RDEAST LAKE RDKEYSTONE RDE TARPON AVEE LIVE OAK ST
Transportation Disadvantaged PopulationThe Pinellas County Planning Department estimates Pinellas County’s transportation disadvantagedeligible population, as defined in Chapter 427 of the Florida Statutes. According to the 2009-2012 PinellasCounty Transportation Disadvantaged Service Plan, the total number of persons estimated to betransportation disadvantaged in Pinellas County in 2008 was 108,719. Transportation Disadvantaged isdefined as low-income (at or below 200% of the Federal Poverty Level) persons with no access to anautomobile. Table 3-5 provides the projected TD population for 2009 through 2014.YearTable 3-52009-2014 Transportation Disadvantaged Population SummaryTotal Transportation DisadvantagedPopulation16 to 64 Years(Non-Elderly)Age Group65+ Years(Elderly)2009 109,167 65,787 43,3802010 109,615 66,057 43,5582011 109,956 66,262 43,6942012 110,297 66,468 43,8292013 110,638 66,673 43,9652014 110,980 66,879 44,100Source: 2008-2012 Pinellas County Transportation Disadvantaged Service Plan.TourismTourism is one of the largest employment sectors in the county. The current build-out condition of much ofPinellas County has pushed tourism-related jobs to areas along the coast, near existing tourist areas, andalong major arterial routes. In 2008, Pinellas County had 42,229 employees working in hotels and otherlodging, eating/drinking establishments, and amusement and recreation services. Table 3-6 presents thenumber of hotel rooms, motel rooms, and food service establishments in Pinellas County in 2008, and itsrelative ranking for each among the 67 counties in Florida. The results in Table 3-6 indicate that PinellasCounty’s tourism industry is strong when compared to the rest of Florida, a state already known for its hightourist population.Table 3-62008 Pinellas County Tourist Facilities SummaryCategory Total Number of Units Rank in Florida CountiesHotel Room 8,664 8thMotel Room 10,769 3rdFood Service Establishment 200,717* 6thSource: Florida Statistical Abstract 2009; Bureau of Economic and Business Research, University of Florida.*Seating capacityAccording to the St. Petersburg/Clearwater Area Convention and Visitor’s Bureau, 4,991,410 people visitedPinellas County in 2009. Figure 3-2 shows the annual tourist population visiting Pinellas County from 1990Tindale-Oliver & Associates, Inc.Pinellas Suncoast Transit AuthoritySeptember 2010 3-13 Transit Development Plan
to 2009. During that time, the annual tourist population in Pinellas County has increased 30 percent. Forthe year 2009, the median annual household income of Pinellas County visitors was $110,680, with anaverage head of household age of 48, and average trip budget for visitors is $2,156. Figure 3-3 provides abreakdown of the average trip budget for visitors to Pinellas County in 2009. Map 3-7 illustrates existingand projected hotel and motel units by TAZ for 2010 and 2020. Most areas with existing hotels and motelsare not projected to experience significant increase, except for the notable increase of hotel and motel unitsoccurring in the Tarpon Springs and Oldsmar areas.Figure 3-2Pinellas County Tourist Trends5,500,0005,000,000Number of Vistors4,500,0004,000,0003,500,0003,000,000Source: St. Petersburg/Clearwater Area Convention and Visitor’s Bureau.Tindale-Oliver & Associates, Inc.Pinellas Suncoast Transit AuthoritySeptember 2010 3-14 Transit Development Plan
ANCLOTE RDUS 19ABELCHER RDPASS A GRILLE WAYBELCHER RD66TH ST N49TH ST N28TH ST SBAY ST NEANCLOTE RDUS 19ABELCHER RDPASS A GRILLE WAYBELCHER RD66TH ST N49TH ST N28TH ST SBAY ST NEEAST LAKE DREAST LAKE DRE LIVE OAK STE LIVE OAK STGULF RD E TARPON AVEMERES BLVDBAY STE KLOSTERMAN RDEAST LAKE RDLANSBROOK PKWYKEYSTONE RDGULF RD E TARPON AVEMERES BLVDBAY STE KLOSTERMAN RDEAST LAKE RDLANSBROOK PKWYKEYSTONE RDALDERMAN RDLAKE FRONT DRPinellas Suncoast Transit AuthorityALDERMAN RDLAKE FRONT DRGULF BLVDMANDALAY AVEISLAND WAYINDIAN ROCKS RDDOUGLAS AVEBAYSHORE BLVDN BETTY LNCOURT STCR 1VIRGINIA STUNION STDREW STDRUID RDMAIN STSUNSET POINT RDLAKEVIEW RDNEBRASKA AVEBELLEAIR RDCR 39ROSERY RD NEEAST BAY DRUS HIGHWAY 19 NSR 580CURLEW RDSR 590MCMULLEN BOOTH RD8TH AVE SW150TH AVE NDRYER AVES FT HARRISON AVE16TH AVE SESOLON AVENORTHSIDE DR142ND AVE NWHITNEY RDCR 611BAYSIDE BRIDGEROOSEVELT BLVD9TH AVE NPHILLIPPE PKWYOAKLEAF BLVDSR 590TAMPA RDSHORE DR ESR 580COURTNEY CAMPBELL CSWYI-275I-275Transit Development Plan2010 - 2020GULF BLVDMANDALAY AVEISLAND WAYINDIAN ROCKS RDCR 1DREW STSOLON AVEMAIN STVIRGINIA STUNION STSUNSET POINT RDDRUID RDLAKEVIEW RDBELLEAIR RDROSERY RD NEEAST BAY DRUS HIGHWAY 19 NSR 580CURLEW RDSR 590MCMULLEN BOOTH RD9TH AVE N8TH AVE SW150TH AVE NDRYER AVES FT HARRISON AVEDOUGLAS AVEBAYSHORE BLVDN BETTY LNCOURT ST16TH AVE SENEBRASKA AVECR 39NORTHSIDE DR142ND AVE NWHITNEY RDCR 611BAYSIDE BRIDGEROOSEVELT BLVDPHILLIPPE PKWYOAKLEAF BLVDSR 590TAMPA RDSHORE DR ESR 580COURTNEY CAMPBELL CSWYI-275I-275´HAMLIN BLVD2 1 0 2MilesWILCOX RDWALSINGHAM RD102NDAVE N131ST ST N125TH ST N113TH ST NSEMINOLE BLVD70TH AVE NDUHME RD150TH AVESTARKEY RD86TH AVE NPARK ST NBLIND PASS RDBRYAN DAIRY RD71ST ST NTYRONE BLVD NPASADENA AVE SGULF BLVD60TH ST NPARK BLVD N46TH AVE N64TH ST S54TH AVE N58TH ST NPINELLAS BAYWAY82ND AVE N1ST AVE N58TH ST S126TH AVE N118TH AVE N62ND AVE N38TH AVE N9TH AVE N11TH AVE S49TH ST SPINELLAS BAYWAY SULMERTON RD34TH ST N30TH AVE N22ND AVE N1ST AVE S34TH ST S28TH ST N5TH AVE N31ST ST SSUNSHINE SKYWAYROOSEVELT BLVD19TH ST N16TH ST N16TH ST NDR MARTIN LUTHER KING JR ST NI-3754TH ST NCENTRAL AVE18TH AVE S26TH AVE S54TH AVE S1ST ST N5TH AVE S14TH AVE S6TH ST S4TH ST SPINELLAS POINT DR S83RD AVE NE62ND AVE NEGANDY BLVDHillsborough >1000 CountyMap 3-7:Total Hotel and MotelUnits by TAZ(2010 and 2020)LEGENDPSTA Bus RoutesLocal RoutesCommuter RoutesExpress RoutesTotal Hotel and Motel Units0 - 5051 - 200201 - 500501 - 1000HAMLIN BLVDULMERTON RDWILCOX RDWALSINGHAM RD102ND AVE N131ST ST N125TH ST N113TH ST NSEMINOLE BLVD70TH AVE NDUHME RD150TH AVESTARKEY RD86TH AVE NPARK ST NBLIND PASS RDBRYAN DAIRY RD71ST ST NTYRONE BLVD NPASADENA AVE SGULF BLVDPARK BLVD N62ND AVE N54TH AVE N46TH AVE N64TH ST S58TH ST N38TH AVE N30TH AVE N4TH ST N1ST ST N22ND AVE N9TH AVE N5TH AVE N1ST AVE N1ST AVE S CENTRAL AVE5TH AVE SPINELLAS BAYWAY82ND AVE N126TH AVE N118TH AVE N60TH ST N16TH ST N11TH AVE S58TH ST S49TH ST S34TH ST SPINELLAS BAYWAY S34TH ST N28TH ST N31ST ST SSUNSHINE SKYWAYROOSEVELT BLVD19TH ST N16TH ST NDR MARTIN LUTHER KING JR ST NI-37514TH AVE S18TH AVE S26TH AVE S54TH AVE S6TH ST S4TH ST SPINELLAS POINT DR S83RD AVE NE62ND AVE NEGANDY BLVD´2 1 0 2MilesHillsborough CountySource: Pinellas County MPOManatee CountyManatee County
$1,000.00$900.00$800.00$700.00$600.00$500.00$400.00$300.00$200.00$100.00$0.00$866.83Figure 3-32009 Pinellas County Average Tourist Trip BudgetTotal Budget = $2,156$765.82$257.39 $266.15Accomodations Food/Entertainment Retail Purchases Rental CarSource: St. Petersburg/Clearwater Area Convention and Visitor’s Bureau.LAND USE INFORMATIONThis sub-section includes information on major land use patterns in Pinellas County, major trip generatorsand attractors, as well as developments of regional impact. The information provides a basicunderstanding of the physical environment within which PSTA operates.Land Use PatternsPinellas County consists primarily of low-density residential development with strip commercialdevelopment along arterial roadways. The southern portion of the county in the St. Petersburg area ismore densely-developed and built-out. The central portion of the county, which includes the Gateway area,contains the county’s largest employment base and most of the county’s industrial land uses. The northernhalf includes large, low-density, single-family residential areas, a concentration of industrial land in theOldsmar area, and large tracts of preservation land east of East Lake Road. Map 3-8 shows the growth indwelling units from 2010 to 2020, and Map 3-9 shows the dwelling units per square mile by TAZ for PinellasCounty (2010 and 2020).PSTA provides bus service to the more densely-populated areas in the county, including the US 19 andSunset Point Road area, Gulf-to-Bay Boulevard. 66 th Street North and Tyrone Boulevard area, along 4 thStreet North, Roosevelt Boulevard, and in and around the downtown areas of St. Petersburg andClearwater. The remaining high-density areas are commercial regions along major arterial roadways,including US 19, 66 th Street, Gulf-to-Bay Boulevard, Bay Drive, Alternate US 19, and Ulmerton Road. Theland use patterns in Pinellas County are not expected to change significantly during the 10-year TDPplanning horizon.Tindale-Oliver & Associates, Inc.Pinellas Suncoast Transit AuthoritySeptember 2010 3-16 Transit Development Plan
EAST LAKE DRBELCHER RDUS 19ACR 39SR 58062ND ST N66TH ST N49TH ST NBELCHER RDMap 3-8:22ND AVE NAbsolute Dwelling UnitsGrowth by TAZ(2010 to 2020)9TH AVE N4TH AVE N5TH AVE NCENTRAL AVE1ST AVE S1ST AVE N5TH AVE S28TH ST S11TH AVE S64TH ST S18TH AVE S34TH ST S49TH ST SPASADENA AVE S14TH AVE S26TH AVE SLEGEND58TH ST SBLIND PASS RDPSTA Bus RoutesLocal Routes54TH AVE SCommuter Routes4TH ST S31ST ST SPINELLAS BAYWAY SGULF BLVDPASS A GRILLE WAYExpress RoutesPINELLAS POINT DR SDwelling Unit GrowthNo Change1 - 5PINELLAS BAYWAY6 - 1011 - 25> 25SUNSHINE SKYWAY´Hillsborough CoSource: Pinellas County MPO2 1 0 2MilesI-275GANDY BLVDManatee Cou62NDAVE NEANCLOTE RDE LIVE OAK STKEYSTONE RDEAST LAKE RDGULF RD E TARPON AVEMERES BLVDE KLOSTERMAN RDBAY STLANSBROOK PKWYALDERMAN RDNEBRASKA AVECR 611CR 1CURLEW RDTAMPA RDSOLON AVEBAYSHORE BLVDSHORE DR EMAIN STPHILLIPPE PKWYUS HIGHWAY 19 NDREW STDRUID RDBELLEAIR RDSTARKEY RD113TH ST NSEMINOLE BLVD102ND AVE NPARK BLVD N4TH ST N54TH AVE N62ND AVE N34TH ST N28TH ST NMCMULLEN BOOTH RDVIRGINIA STUNION STSUNSET POINT RDDOUGLAS AVEEAST BAY DRSR 590BAYSIDE BRIDGELAKEVIEW RD8TH AVE SW150TH AVE NINDIAN ROCKS RDULMERTON RD126TH AVE NWALSINGHAM RD 118TH AVE N131ST ST N125TH ST N60TH ST N16TH ST N1ST ST NDR MARTIN LUTHER KING JR ST NN BETTY LNISLAND WAYMANDALAY AVECOURTNEY CAMPBELL CSWYCOURT STN FT HARRISON AVEWYATT ST38TH AVE N30TH AVE NPinellas Suncoast Transit AuthorityTransit Development PlanFY 2011 - FY 2020I-275OAKLEAF BLVDNORTHSIDE DRSR 580SR 5909TH AVE NROSERY RD NEWHITNEY RDROOSEVELT BLVD142ND AVE NDRYER AVE 16TH AVE SEWILCOX RDROOSEVELT BLVDHAMLIN BLVD86TH AVE N82ND AVE N16TH ST N70TH AVE N19TH ST N46TH AVE N71ST ST NPARK ST NDUHME RD58TH ST NTYRONE BLVD NGULF BLVD
ANCLOTE RDUS 19ABELCHER RDPASS A GRILLE WAYBELCHER RD66TH ST N49TH ST N28TH ST SBAY ST NEANCLOTE RDUS 19ABELCHER RDPASS A GRILLE WAYBELCHER RD66TH ST N49TH ST N28TH ST SBAY ST NEEAST LAKE DREAST LAKE DRE LIVE OAK STE LIVE OAK STGULF RD E TARPON AVEMERES BLVDBAY STE KLOSTERMAN RDEAST LAKE RDLANSBROOK PKWYKEYSTONE RDGULF RD E TARPON AVEMERES BLVDBAY STE KLOSTERMAN RDEAST LAKE RDLANSBROOK PKWYKEYSTONE RDALDERMAN RDLAKE FRONT DRPinellas Suncoast Transit AuthorityALDERMAN RDLAKE FRONT DRGULF BLVDMANDALAY AVEISLAND WAYINDIAN ROCKS RDDOUGLAS AVEBAYSHORE BLVDN BETTY LNCOURT STCR 1VIRGINIA STUNION STDREW STDRUID RDMAIN STSUNSET POINT RDLAKEVIEW RDNEBRASKA AVEBELLEAIR RDCR 39ROSERY RD NEEAST BAY DRUS HIGHWAY 19 NSR 580CURLEW RDSR 590MCMULLEN BOOTH RD8TH AVE SW150TH AVE NDRYER AVES FT HARRISON AVE16TH AVE SESOLON AVENORTHSIDE DR142ND AVE NWHITNEY RDCR 611BAYSIDE BRIDGEROOSEVELT BLVD9TH AVE NPHILLIPPE PKWYOAKLEAF BLVDSR 590TAMPA RDSHORE DR ESR 580COURTNEY CAMPBELL CSWYI-275I-275Transit Development PlanFY 2011 - FY 2020GULF BLVDMANDALAY AVEISLAND WAYINDIAN ROCKS RDCR 1DREW STSOLON AVEMAIN STVIRGINIA STUNION STSUNSET POINT RDDRUID RDLAKEVIEW RDBELLEAIR RDROSERY RD NEEAST BAY DRUS HIGHWAY 19 NSR 580CURLEW RDSR 590MCMULLEN BOOTH RD9TH AVE N8TH AVE SW150TH AVE NDRYER AVES FT HARRISON AVEDOUGLAS AVEBAYSHORE BLVDN BETTY LNCOURT ST16TH AVE SENEBRASKA AVECR 39NORTHSIDE DR142ND AVE NWHITNEY RDCR 611BAYSIDE BRIDGEROOSEVELT BLVDPHILLIPPE PKWYOAKLEAF BLVDSR 590TAMPA RDSHORE DR ESR 580COURTNEY CAMPBELL CSWYI-275I-275´HAMLIN BLVD2 1 0 2MilesWILCOX RDWALSINGHAM RD102NDAVE N131ST ST N125TH ST N113TH ST NSEMINOLE BLVD70TH AVE NDUHME RD150TH AVESTARKEY RD86TH AVE NPARK ST NBLIND PASS RDBRYAN DAIRY RD71ST ST NTYRONE BLVD NPASADENA AVE SGULF BLVD60TH ST NPARK BLVD N46TH AVE N64TH ST S54TH AVE N58TH ST NPINELLAS BAYWAY82ND AVE N1ST AVE N58TH ST S126TH AVE N118TH AVE N62ND AVE N38TH AVE N9TH AVE N11TH AVE S49TH ST SPINELLAS BAYWAY SULMERTON RD34TH ST N30TH AVE N22ND AVE N1ST AVE S34TH ST S28TH ST N5TH AVE N31ST ST SSUNSHINE SKYWAYROOSEVELT BLVD19TH ST N16TH ST N16TH ST NDR MARTIN LUTHER KING JR ST NI-3754TH ST NCENTRAL AVE18TH AVE S26TH AVE S54TH AVE S1ST ST N5TH AVE S14TH AVE S6TH ST S4TH ST SPINELLAS POINT DR S83RD AVE NE62ND AVE NEGANDY BLVDHillsborough >3000 CountyMap 3-9:Dwelling Units Densityby TAZ(2010 and 2020)LEGENDPSTA Bus RoutesLocal RoutesCommuter RoutesExpress RoutesDwelling Units per Square Mile
Major Trip GeneratorsThe major trip generators in Pinellas County consist of medical facilities, shopping centers, majoremployers, government offices, colleges/universities, sports/entertainment facilities, and the CentralBusiness Districts (CBDs) in St. Petersburg and Clearwater. Specific generators include Tropicana Field,Clearwater/St. Petersburg Airport, and the commercial development areas designated by the localcommunities. The City of St. Petersburg is the only area with a CBD that functions as a major commercialretail and activity center. The City of Clearwater’s downtown is primarily government activities withincreasing residential and mixed-use development. Map 3-10 shows the major trip generators andattractors in Pinellas County.Tindale-Oliver & Associates, Inc.Pinellas Suncoast Transit AuthoritySeptember 2010 3-19 Transit Development Plan
EAST LAKE DRBELCHER RDUS 19ACR 39SR 58062ND ST N66TH ST N49TH ST NBELCHER RDMap 3-10:Major TripGenerators and Attractors28TH ST S14TH AVE S18TH AVE SLEGEND")" Major Employer"q Medical Facility)"< Shopping Center >500K Sq Ft4TH ST S54TH AVE S31ST ST SPINELLAS BAYWAY SGULF BLVDPASS A GRILLE WAYPINELLAS POINT DR S< Shopping Center 100K-500K Sq Ft)")" k College/UniversityPSTA Bus RoutesPINELLAS BAYWAYLocal RoutesCommuter RoutesSUNSHINE SKYWAY´Express Routes2 1 0 2Hillsborough CoSource: Pinellas County MPOI-275GANDY BLVD62NDAVE NEANCLOTE RDKEYSTONE RD)" < )"
Developments of Regional ImpactDevelopments of Regional Impact (DRIs) are large, multi-use developments that influence a large regionand are good indicators of future growth. The Tampa Bay Regional Planning Council (TBRPC) isresponsible for tracking DRIs and maintaining development agreements. Table 3-7 lists the approved DRIsin Pinellas County in 2010 compiled from the data provided by the TBRPC. Map 3-11 depicts the coverageof the DRIs listed in Table 3-7.DRI # Project Name Local Govt.3Imperial Land Corp.of Clearwater(Highland Lakes)Table 3-7DRIs in Pinellas CountyBuildout/Expiration*Land UseDevelopment ParametersTotalApprovedDuringReport YrCumulativeDev’tPinellas Withdrawn N/A N/A N/A N/A12 Gateway St. Pete Withdrawn N/A N/A N/A N/A14The Shoppes at ParkPlacePinellas ParkNot Appl.NoneTotal AcresRetail (SF/GLA)Theater (SF)(Seats)(Screens)Residential (MF #)66.1523,00090,0004,0002012420 Ramblewood Pinellas Withdrawn N/A N/A N/A N/A24Tarpon Lake Village(aka Lansbrook)Pinellas5/13/04Not Appl.11/01/200612/31/2009Total AcresResidential (#)Retail (GSF)4,0008,230205,75000002549,016523,00090,0004,0001606,775179,16336 Boot Ranch Pinellas Withdrawn N/A N/A N/A N/A40 North Lake Village St. Pete Withdrawn N/A N/A N/A N/A579297CountrysideAnnexation II(U.S. Homes)Park Place(fka Metro)St. PetersburgIntown AreawideClearwater Withdrawn N/A N/A N/A N/AClearwater9/09/09St. Pete5/19/0912/31/201112/31/201112/30/201012/30/2010Total AcresOffice (GSF)Industrial (GSF)Retail (GSF)Residential/MF (#)Total AcresResidential (#)Rooming Units (#)Office (GSF)Retail (GSF)Industrial (GSF)Boat Slips (#)Museum (GSF)Exhibit (GSF)Movie Theater (#)99404,639200,00081,1203904582,7009162,696,8651,170,773234,500141 (Wet)86,00050,0002400003080-3,0816,0040074,12400329,929100,00084,8433901,88048369,653319,263074 (Wet)-24,94721,78920Tindale-Oliver & Associates, Inc.Pinellas Suncoast Transit AuthoritySeptember 2010 3-21 Transit Development Plan
Table 3-7 (continued)DRIs in Pinellas CountyDRI #Project NameLocalGovt.Buildout/ExpirationLand UseDevelopment ParametersTotal DuringApproved Report YrCumulativeDev’t107Tampa Bay Park ofCommercePinellas See DRI #158 N/A N/A N/A N/A111Forest Lake/Ph. II121 Carillon123 Bay Area Outlet Mall132Gateway CentrePinellas ParkOldsmarNot Appl.St. Pete2/05/10Largo7/14/09PinellasPark11/19/08BUILTOUT(7/27/2004)12/31/201012/31/201012/31/201212/31/201212/31/201012/31/2013Total AcresResidential (#)RetailTotal AcresOffice (GSF)Hotel (Rooms)Total AcresRetail (GSF)Office (GSF)Condos (#)Total AcresIndustrial (GSF)Office (GSF)Retail (GSF)Hotel (Rooms)Residential/MF (#)Auto Museum(GSF)3812,263116,0001802,675,00030034646,46030,0002584942,007,4251,988,711246,00050030012,575N/A25,00000000013,5000012,575N/A2,226,54522772,46000945,369287,54532,538030012,575Gateway CentreSt. PetersburgSt. Pete10/14/0912/31/201312/31/2013Total AcresIndustrial (GSF)Office (GSF)500,000450,00050,00000000135 Cypress LakesOldsmar7/27/06BUILDOUT(12/05/06)Total AcresResidential/SF (#)Residential/MF (#)Office (GSF)Retail (GSF)Hotel (Rooms)440250250250,000250,000125N/AN/A136 Central Plaza St. Pete Withdrawn N/A N/A N/A N/A137 Marina del Sol St. Pete Withdrawn N/A N/A N/A N/A143156Feather SoundCommerce CenterLargo Mall(fka Carriage HillMall S/D)Pinellas Withdrawn N/A N/A N/A N/ALargoNot Appl.BUILTOUT(12/04/1998)Total AcresRetail (GSF)61591,534N/AN/ATindale-Oliver & Associates, Inc.Pinellas Suncoast Transit AuthoritySeptember 2010 3-22 Transit Development Plan
DRI # Project Name Local Govt.157158174195221TrinityCommunitiesTampa Bay ParkofCommerce S/DBay Vista(fka PioneerCenter S/D)GatewayAreawidePinellas Co.CriminalCourthouse FQDPasco/Pinellas12/23/09Oldsmar/Pinellas9/08/09Largo3/06/09St. Pete5/12/09Pinellas12/08/09Table 3-7 (continued)DRIs in Pinellas CountyBuildout/Expiration12/13/201612/13/20206/01/201212/14/2013BUILTOUT(9/25/09)12/30/201312/30/2013201012/31/2015Land UseTotal AcresResidential/SF (#)Residential/MF (#)Mobile Homes (#)Comm. Pk./OfficeComm. Pk/IndstrlComm. Pk/MixRetail (GSF)Med. Office (GSF)Nghd. Ctr. (GSF)Office (GSF)Hospital (Beds)Life Care (Units)Total AcresIndustrial (GSF)Office (GSF)Retail (GSF)Residential (#)Total AcresOffice (GSF)Retail (GSF)Total AcresOffice (GSF)Industrial (GSF)Retail (GSF)Residential (#)Hotel (Rooms)Total AcresJail Expan. (GSF)(Beds)Court Expan. (GSF)Source: Tampa Bay Regional Planning Council.Note: List of DRIs as of 03/31/10.*Withdrawn – Indicates projects which were submitted for review but were withdrawn from the review process.Development ParametersTotalApproved3,7025,433 03,134 01,235 0536,556 0160,144 0717,800 01,101,548 0321,680 060,000 043,000 02400840 1201,200963,716650,28450,00001391,180,00020,0001,6532,979,9162,368,224149,9974,439120642,061,0004,811500,000During ReportYr0000N/AN/A00000000CumulativeDev’t3,7583590246,24600162,31971,62804,0220120638,580580,66200N/AN/A1,385,6281,995,70157,0841,0070Not Spec.Not Spec.500,000Tindale-Oliver & Associates, Inc.Pinellas Suncoast Transit AuthoritySeptember 2010 3-23 Transit Development Plan
EAST LAKE DRBELCHER RDUS 19ACR 39SR 58062ND ST N66TH ST N49TH ST NBELCHER RDExisting Developments ofRegional Impact(DRI)22ND AVE N9TH AVE N4TH AVE N5TH AVE NCENTRAL AVE1ST AVE S1ST AVE NLEGEND5TH AVE S28TH ST S11TH AVE S64TH ST S18TH AVE S34TH ST S49TH ST SPASADENA AVE S14TH AVE SPSTA Bus RoutesLocal Routes26TH AVE SCommuter Routes58TH ST SBLIND PASS RDExpress RoutesDRI and Land Use54TH AVE SAttraction4TH ST S31ST ST SPINELLAS BAYWAY SGULF BLVDPASS A GRILLE WAYCommercialPINELLAS POINT DR SEducationHotelIndustrialPINELLAS BAYWAYMixed UseOfficeResidentialSUNSHINE SKYWAY´Hillsborough CoSource: Tampa Bay Regional Planning Council2 1 0 2MilesI-275GANDY BLVDManatee Cou62NDAVE NEANCLOTE RDE LIVE OAK STKEYSTONE RDEAST LAKE RDGULF RD E TARPON AVEMERES BLVDE KLOSTERMAN RDBAY STLANSBROOK PKWYALDERMAN RDNEBRASKA AVECR 611CR 1CURLEW RDTAMPA RDSOLON AVEBAYSHORE BLVDSHORE DR EMAIN STPHILLIPPE PKWYUS HIGHWAY 19 NDREW STDRUID RDBELLEAIR RDSTARKEY RD113TH ST NSEMINOLE BLVD102ND AVE NPARK BLVD N4TH ST N54TH AVE N62ND AVE N34TH ST N28TH ST NMCMULLEN BOOTH RDVIRGINIA STUNION STSUNSET POINT RDDOUGLAS AVEEAST BAY DRSR 590BAYSIDE BRIDGELAKEVIEW RD8TH AVE SW150TH AVE NINDIAN ROCKS RDULMERTON RD126TH AVE NWALSINGHAM RD 118TH AVE N131ST ST N125TH ST N60TH ST N16TH ST N1ST ST NDR MARTIN LUTHER KING JR ST NN BETTY LNISLAND WAYMANDALAY AVECOURTNEY CAMPBELL CSWYCOURT STN FT HARRISON AVEWYATT ST38TH AVE N30TH AVE NPinellas Suncoast Transit AuthorityTransit Development PlanFY 2011 - FY 2020I-275Map 3-11:OAKLEAF BLVDNORTHSIDE DRSR 580SR 5909TH AVE NROSERY RD NEWHITNEY RDROOSEVELT BLVD142ND AVE NDRYER AVE 16TH AVE SEWILCOX RDROOSEVELT BLVDHAMLIN BLVD86TH AVE N82ND AVE N16TH ST N70TH AVE N19TH ST N46TH AVE N71ST ST NPARK ST NDUHME RD58TH ST NTYRONE BLVD NGULF BLVD
COMMUTING PATTERNSThe 2000 Census provides the latest information on commuting patterns. According to the 2000 Census,13 percent of the work trips terminating in Pinellas County originate outside the county, an increase of 3percent since 1990. The analysis of Census data shows that 86 percent of the worker population works inPinellas County, while 12 percent commutes to neighboring counties. The inter-county commuter flowincreased from 1990 to 2000 due largely to the residential development occurring in Pasco County andwestern Hillsborough County. In addition, work commuter flows also increased to Manatee and Hernandocounties over the same time period. Table 3-8 summarizes the county of work for workers residing inPinellas County, while Table 3-9 reflects the number of people commuting to Pinellas County fromneighboring counties.Table 3-8County of Work for Workers Residing in Pinellas County, 2000County of ResidencePinellasCountyHillsboroughCountyPascoCountyCounty of WorkHernandoCountyManateeCountySarasotaCountyOtherTotalPinellasCounty(2000)PinellasCounty(1990)Number of Workers 360,285 44,000 5,306 362 1,452 634 6,586 418,625% DISTRIBUTION 86.1% 10.5% 1.3% 0.1% 0.3% 0.2% 1.6% 100.0%Number of Workers 332,695 32,150 3,791 257 929 641 6,443 376,906% DISTRIBUTION 88.3% 8.5% 1.0% 0.1% 0.2% 0.2% 1.7% 100.0%PERCENT CHANGE8.3% 36.9% 40.0% 40.9% 56.3% -1.1% 2.2% 11.1%(1990 - 2000)Source: 2000 Census commuter flow data and 2002/06 PSTA TDP.Note: Data represent number of workers 16 years old and over in the commuter flow.County of WorkTable 3-9Commuting from Neighboring Counties to Pinellas County, 2000PinellasCountyHillsboroughCountyPascoCountyCounty of ResidenceHernandoCountyManateeCountySarasotaCountyOtherTotalPinellasCounty(2000)PinellasCounty(1990)Number of Workers 360,285 25,175 21,073 1,537 2,410 581 2,653 413,714%DISTRIBUTION 87.1% 6.1% 5.1% 0.4% 0.6% 0.1% 0.6% 100.0%Number of Workers 332,695 16,783 14,286 1,081 780 501 3,715 369,841%DISTRIBUTION 90.0% 4.5% 3.9% 0.3% 0.2% 0.1% 1.0% 100.0%PERCENT CHANGE8.3% 50.0% 47.5% 42.2% 209.0% 16.0% 28.6% 11.9%(1990 - 2000)Source: 2000 Census commuter flow data and 2002/06 PSTA TDP.Note: Data represent number of workers 16 years old and over in the commuter flow.Tindale-Oliver & Associates, Inc.Pinellas Suncoast Transit AuthoritySeptember 2010 3-25 Transit Development Plan
ROADWAY CONDITIONSPinellas County’s roadway system is primarily a grid system with several primary north-south routes and asystem of east-west roadways providing connections. The major north-south roadways are US 19,Alternate US 19, McMullen-Booth Road, Missouri Boulevard, Starkey/Keene Road, and Belcher Road.Primary east-west routes are Park Boulevard, Bay Drive, Ulmerton Road, Tampa Road, Gulf-to-BayBoulevard, SR 580, and Sunset Point Road. Northern and southern Pinellas County have differentroadway systems. Southern Pinellas County consists of a more traditional grid system with avenuesoriented east-west and numbered streets oriented north-south. Northern Pinellas County consists of moresuburban development with arterial roads providing access to subdivisions that have limited connections tothe road network.Roadway Level of ServiceThe MPO publishes a Roadway Level of Service Report on an annual basis. According to the data used inthe 2009 Roadway Level of Service Report, the average Vehicle Miles of Travel (VMT) for 2009 was14,306,900. Of the 587 roadway miles included in the Pinellas County major road network, 13.6 percent, or80 roadway miles, are reported as deficient. Figures 3-4 through 3-7 illustrate the countywide aggregatetrends in annual average daily traffic, vehicle miles traveled, percentage of roadways operating overcapacity, and the volume/capacity ratio in Pinellas County between 2007 and 2009. Primarily driven by theeconomic recession beginning at the end of 2007, roadway deficiency has improved during this period dueto overall declines in vehicle travel.Figure 3-4 Figure 3-5Annual Average Daily Traffic (AADT)Vehicle Miles Traveled (VMT)15,400,00015,200,00015,000,00014,800,00015,150,49214,653,45826,00025,50025,00025,78524,92014,600,00014,400,00014,306,90024,50024,35314,200,00014,000,00024,00013,800,0002007 2008 200923,5002007 2008 2009Tindale-Oliver & Associates, Inc.Pinellas Suncoast Transit AuthoritySeptember 2010 3-26 Transit Development Plan
Figure 3-6 Figure 3-7% Roadways Above Capacity Volume/Capacity (VC) RatioMiles of Roadw ay Miles over Capacity700600587 587 58750040030020010087 89 8002007 2008 200937%36%35%34%33%32%31%30%29%28%27%36%33%30%2007 2008 2009MPO Committed Roadway ProjectsThe 2035 LRTP contains a list of committed roadway projects. Committed roadway projects are those thatare funded in the first five years of the LRTP. These projects have funds programmed in the TransportationImprovement Program (TIP) or are funded by dedicated revenue sources that are anticipated to commenceprior to 2015. Map 3-12 displays the MPO committed roadway projects prior to 2015.CONCLUSIONWhile the use of public transportation to work increased from 1990 to 2000, transit’s share of commutingtrips decreased between 2000 and 2008 from 1.9 percent to 1.6 percent. In addition, the number ofhouseholds with no vehicle available dropped from 9.2 percent in 2000 to 7.8 percent in 2008. This hasbeen the case despite transit-favorable income changes developing in Pinellas County. Pinellas County’smedian household income grew slower than the inflation rate from $37,111 in 2000 to $45,895 in 2008.Nevertheless, each area of Pinellas County appears to have an opportunity for increased publictransportation considering that, when compared to other Florida counties, Pinellas County is better suited totransit service, given density and near build-out conditions than all but the most urbanized, such as Miami-Dade County.Four major demographic aspects that play a large role in the demand for transit are analyzed below interms of their impact on transit ridership within Pinellas County.Tindale-Oliver & Associates, Inc.Pinellas Suncoast Transit AuthoritySeptember 2010 3-27 Transit Development Plan
EAST LAKE DRBELCHER RDUS 19ACR 39SR 58062ND ST N66TH ST N49TH ST NBELCHER RD22ND AVE NMap 3-12:9TH AVE N5TH AVE NMPO CommittedRoadway Projects4TH AVE NCENTRAL AVE1ST AVE S1ST AVE N5TH AVE S28TH ST S11TH AVE S64TH ST S18TH AVE S34TH ST S49TH ST SPASADENA AVE S14TH AVE SLEGEND26TH AVE S58TH ST SBLIND PASS RDProject Improvement Type6 Lanes Divided to 6 Lanes Partially Controlled4TH ST S54TH AVE S31ST ST SPINELLAS BAYWAY SGULF BLVDPASS A GRILLE WAY4 Lanes Partially Controlled to 6 Lanes Partially ControlledPINELLAS POINT DR S4 Lanes Divided to 6 Lanes Divided2 Lanes Undivided to 4 Lanes DividedPINELLAS BAYWAY2 Lanes Undivided to 2 Lanes EnhancedSUNSHINE SKYWAY´2 1 0 2Hillsborough CoSource: Pinellas County MPOMilesI-275GANDY BLVDManatee Cou62NDAVE NEANCLOTE RDE LIVE OAK STKEYSTONE RDEAST LAKE RDGULF RD E TARPON AVEMERES BLVDE KLOSTERMAN RDBAY STLANSBROOK PKWYALDERMAN RDNEBRASKA AVECR 611CR 1CURLEW RDTAMPA RDSOLON AVEBAYSHORE BLVDSHORE DR EMAIN STPHILLIPPE PKWYUS HIGHWAY 19 NDREW STDRUID RDBELLEAIR RDSTARKEY RD113TH ST NSEMINOLE BLVD102ND AVE NPARK BLVD N4TH ST N54TH AVE N62ND AVE N34TH ST N28TH ST NMCMULLEN BOOTH RDVIRGINIA STUNION STSUNSET POINT RDDOUGLAS AVEEAST BAY DRSR 590BAYSIDE BRIDGELAKEVIEW RD8TH AVE SW150TH AVE NINDIAN ROCKS RDULMERTON RD126TH AVE NWALSINGHAM RD 118TH AVE N131ST ST N125TH ST N60TH ST N16TH ST N1ST ST NDR MARTIN LUTHER KING JR ST NN BETTY LNISLAND WAYMANDALAY AVECOURTNEY CAMPBELL CSWYCOURT STN FT HARRISON AVEWYATT ST38TH AVE N30TH AVE NPinellas Suncoast Transit AuthorityTransit Development PlanFY 2011 - FY 2020I-275OAKLEAF BLVDNORTHSIDE DRSR 580SR 5909TH AVE NROSERY RD NEWHITNEY RDROOSEVELT BLVD142ND AVE NDRYER AVE 16TH AVE SEWILCOX RDROOSEVELT BLVDHAMLIN BLVD86TH AVE N82ND AVE N16TH ST N70TH AVE N19TH ST N46TH AVE N71ST ST NPARK ST NDUHME RD58TH ST NTYRONE BLVD NGULF BLVD
PopulationPinellas County population has increased by less than 2 percent between 2000 and 2008, according toBEBR. Population density is the highest of all Florida counties. In addition to the year-round population,the 2000 Census found that 7.1 percent of houses, or 34,111 houses, in Pinellas County were retained forseasonal, recreational, or occasional use. The Pinellas County Planning Department estimates thatseasonal and tourist populations were 76,874 and 89,403, respectively, in 2006. These two numbers areexpected to increase by 6.7 percent and 3.2 percent, respectively, by 2025.The population share of those over the age of 65 years has decreased slightly between 2000 and 2008,from 22.5 percent of the population in 2000 to 21.1 percent of the population in 2008. Similarly, thepopulation share of those under the age of 19 has decreased slightly from 21.1 percent in 2000 to 20.9percent in 2008. However, as mentioned before, the median age in Pinellas County has been steadilyincreasing since 1990.EconomyWhile the unemployment rate has increased from 4.3 percent in 2000 to 6.3 percent in 2008 (11.3% in2009), the civilian labor force in Pinellas County increased from 58.2 percent to 60.0 percent of thepopulation over the age of 16 during the same time period, according to the 2008 American CommunitySurvey.The percent of the population below poverty level increased slightly from 10.0 percent to 10.4 percentbetween 2000 and 2008. During the same time, the County median household income increased from$37,111 to $45,895, an increase of more than 23 percent.Cost of HousingThe cost of housing has been increasing rapidly in Pinellas County and outpacing the growth in averageincome. Figure 3-8 shows the median cost of housing in Pinellas County compared with the medianhousehold income. While the cost of housing increased more than 101 percent between 2000 and 2008,the median household income increased only about 23.7 percent. Although housing cost experiencedsevere depreciation recently, it is expected to outpace the growth in average income in the long range.Tindale-Oliver & Associates, Inc.Pinellas Suncoast Transit AuthoritySeptember 2010 3-29 Transit Development Plan
Figure 3-8Housing Costs and Household Income$250,000Median Cost of HousingMedian Household Income$200,000$194,700$150,000$166,200$100,000$96,500$73,500$50,000$37,111$40,694 $45,895$26,296$01990 2000 2005 2008Source: 1990 and 2000 Census, 2005 and 2008 American Community Survey.Mobility CharacteristicsAccording to the U.S. Census, the percentage of households with no vehicles in Pinellas County decreasedfrom 9.2 percent in 2000 to 7.8 percent in 2008. Households with 2 or more cars increased from 43.9percent to 46.2 percent during that same time period. Mean travel time to work has decreased slightly inPinellas County from 23.6 minutes in 2000 to 23.1 minutes in 2008. Increased auto ownership is notconducive to transit use.Tindale-Oliver & Associates, Inc.Pinellas Suncoast Transit AuthoritySeptember 2010 3-30 Transit Development Plan
SECTION 4EXISTING PSTA SERVICE LEVELSThis section provides a review of existing PSTA service levels and is divided into four subsections includingexisting service, operating statistics, performance evaluation and trends, and a peer review. The review ofexisting service includes a general description of the structure of PSTA and its system characteristics. Theoperating statistics and performance evaluation and trends render a detailed examination of route-by-routeoperating performance. Peer review provides an opportunity for PSTA to compare its system-wideeffectiveness and efficiency indicators with other peer transit systems to determine how well PSTA isperforming compared to similar transit agencies. The results of the peer review serve as a starting point forPSTA to adjust its operations and/or policies to achieve better system cost efficiency and operatingperformance.EXISTING SERVICEThe Pinellas Suncoast Transit Authority provides service to Pinellas County. The county is the smallest,yet most densely populated county in Florida with a population of over 900,000. Presently, PSTA has over550 employees and 200 buses, and serves 21 of the 24 communities in Pinellas County plusunincorporated areas. PSTA's route network can be generally categorized as a hub and spoke system withthree major hubs: downtown St. Petersburg, Grand Central Station, and downtown Clearwater. Maps 4-1and 4-2 illustrate the transit service population within a quarter-mile and three-quarter mile distance of thefixed-route network, respectively. A table presenting detailed population characteristics within each servicearea is included for each map.PSTA currently operates buses on 36 local routes (30 base routes, 2 circulators, and 4 commuter routes)and 1 trolley service, providing transit service coverage to 21 of the 24 incorporated communities plus theunincorporated area of Pinellas County. Service is not provided to Kenneth City, Belleair Beach, andBelleair Shores. In addition, routes 100X and 300X provide express service to Tampa. The PSTAweekday peak fleet requirement was 157 in FY 2009. The Saturday vehicle requirement was 94 buses;while the Sunday/Holiday service requirement was 59 buses. PSTA provides service to St. Pete Beachand Treasure Island via a service contract, although these areas are not part of the transit authority. Inaddition, PSTA provides demand response service to persons with disabilities in accordance with the ADAimplementing regulations. Map 4-3 shows the PSTA’s fixed-route system as of October 2009.Tindale-Oliver & Associates, Inc.Pinellas Suncoast Transit AuthoritySeptember 2010 4-1 Transit Development Plan
BELCHER RDUS 19ACR 39SR 58062ND ST N66TH ST N49TH ST NBELCHER RD28TH ST SMap 4-1:1/4-Mile Service AreaCharacteristics14TH AVE S54TH AVE S´LEGEND¯À PSTA FacilityPASS A GRILLE WAYPINELLAS POINT DR STransit HubÅ aa Major Transfer CenterÆÀ2 1 0 2MilesRegional Mall"e!P Existing Park-and-Ride FacilityArea inSquareMilesSUNSHINE SKYWAYHouseholds withAnnual IncomeBelow $25,000Householdswith ZeroVehiclesPopulationUnder 16PopulationOver 60TotalPopulationHillsborough CoPSTA Bus Routes1/4-Mile Total 602,836 176,851 88,992 21,686 68,267 15614-mile BufferManatee CouSource: PSTACounty Total 926,856 275,992 135,027 28,678 92,270 289I-275GANDY BLVD62NDAVE NEE LIVE OAK STKEYSTONE RDEAST LAKE RD"eGULF RDE TARPON AVEMERES BLVDE KLOSTERMAN RDBAY STLANSBROOK PKWYALDERMAN RDNEBRASKA AVECR 611CR 1CURLEW RDÆÀ"e"e"e126TH AVE N!P¯ÀÅaaÅ aa "eÅ "eaa30TH AVE N22ND AVE N"e1ST AVE N1ST AVE SÆÀÅ aa!PTAMPA RDOAKLEAF BLVDNORTHSIDE DRSOLON AVEBAYSHORE BLVDSHORE DR EMAIN STPHILLIPPE PKWYUS HIGHWAY 19 NDREW STDRUID RDBELLEAIR RDSTARKEY RD113TH ST N!P"ePARK BLVD N4TH ST N54TH AVE N62ND AVE N1ST ST N38TH AVE N9TH AVE NÆÀ5TH AVE NCENTRAL AVE34TH ST SPARK ST N58TH ST NSEMINOLE BLVD102ND AVE N34TH ST N28TH ST N46TH AVE N5TH AVE S18TH AVE S31ST ST SMCMULLEN BOOTH RDVIRGINIA STUNION STSUNSET POINT RDDOUGLAS AVEEAST BAY DRSR 590BAYSIDE BRIDGELAKEVIEW RD8TH AVE SW150TH AVE NINDIAN ROCKS RDULMERTON RDWALSINGHAM RD 118TH AVE NDR MARTIN LUTHER KING JR ST N86TH AVE N82ND AVE N70TH AVE N11TH AVE S58TH ST S49TH ST S131ST ST N60TH ST NTYRONE BLVD N26TH AVE S4TH ST SN BETTY LNISLAND WAYMANDALAY AVECOURTNEY CAMPBELL CSWYCOURT STN FT HARRISON AVEWYATT STPinellas Suncoast Transit AuthorityTransit Development PlanFY 2011 - FY 2020I-275SR 580SR 5909TH AVE NWHITNEY RD142ND AVE NWILCOX RDROSERY RD NEROOSEVELT BLVDDRYER AVE 16TH AVE SEROOSEVELT BLVD125TH ST N16TH ST N 16TH ST NHAMLIN BLVD71ST ST N19TH ST NDUHME RD4TH AVE N64TH ST SPASADENA AVE SBLIND PASS RDPINELLAS BAYWAY SGULF BLVDPINELLAS BAYWAYGULF BLVD
BELCHER RDUS 19ACR 39SR 58062ND ST N66TH ST N49TH ST NBELCHER RD28TH ST S14TH AVE SMap 4-2:3/4-Mile Service AreaCharacteristics54TH AVE SLEGEND¯À PSTA FacilityPASS A GRILLE WAYPINELLAS POINT DR S´Transit HubÅ aa Major Transfer CenterÆÀ2 1 0 2SUNSHINE SKYWAYMilesRegional Mall"e!P Existing Park-and-Ride FacilityArea inSquareMilesHouseholds withAnnual IncomeBelow $25,000Householdswith ZeroVehiclesPopulationUnder 16PopulationOver 60TotalPopulationHillsborough CoPSTA Bus Routes3/4-mile Buffer3/4-Mile Total 846,910 252,967 122,706 27,598 88,455 234Manatee CouSource: PSTACounty Total 926,856 275,992 135,027 28,678 92,270 289I-275GANDY BLVD62NDAVE NEE LIVE OAK STKEYSTONE RDEAST LAKE RD"eGULF RDE TARPON AVEMERES BLVDE KLOSTERMAN RDBAY STLANSBROOK PKWYALDERMAN RDNEBRASKA AVECR 611CR 1CURLEW RDÆÀ"e"e"e!P¯ÀÅaaÅ aa "eÅ "eaa30TH AVE N22ND AVE N"e1ST AVE N1ST AVE SÆÀÅ aa!PTAMPA RDOAKLEAF BLVDNORTHSIDE DRSOLON AVEBAYSHORE BLVDSHORE DR EMAIN STPHILLIPPE PKWYUS HIGHWAY 19 NDREW STDRUID RDBELLEAIR RDSTARKEY RD113TH ST N!P"ePARK BLVD N4TH ST N54TH AVE N62ND AVE N1ST ST N38TH AVE N9TH AVE NÆÀ5TH AVE NCENTRAL AVE34TH ST SPARK ST N58TH ST NSEMINOLE BLVD102ND AVE N34TH ST N28TH ST N46TH AVE N5TH AVE S18TH AVE S31ST ST SMCMULLEN BOOTH RDVIRGINIA STUNION STSUNSET POINT RDDOUGLAS AVEEAST BAY DRSR 590BAYSIDE BRIDGELAKEVIEW RD8TH AVE SW150TH AVE NINDIAN ROCKS RDULMERTON RDWALSINGHAM RD 118TH AVE NDR MARTIN LUTHER KING JR ST N86TH AVE N82ND AVE N70TH AVE N11TH AVE S58TH ST S49TH ST S131ST ST N60TH ST NTYRONE BLVD N26TH AVE S4TH ST SN BETTY LNISLAND WAYMANDALAY AVECOURTNEY CAMPBELL CSWYCOURT STN FT HARRISON AVEWYATT STPinellas Suncoast Transit AuthorityTransit Development PlanFY 2011 - FY 2020I-275SR 580SR 5909TH AVE NWHITNEY RD142ND AVE NWILCOX RDROSERY RD NEROOSEVELT BLVDDRYER AVE 16TH AVE SE126TH AVE NROOSEVELT BLVD125TH ST N16TH ST N 16TH ST NHAMLIN BLVD71ST ST N19TH ST NDUHME RD4TH AVE N64TH ST SPASADENA AVE SBLIND PASS RDPINELLAS BAYWAY SGULF BLVDPINELLAS BAYWAYGULF BLVD
EAST LAKE DRBELCHER RDUS 19ACR 39SR 58062ND ST N66TH ST N49TH ST NBELCHER RDLEGEND¯À PSTA Facility28TH ST S14TH AVE STransit HubÅ aa Major Transfer CenterÆÀ54TH AVE SRegional Mall"e!P Existing Park-and-Ride FacilityPASS A GRILLE WAYPINELLAS POINT DR SMinority TractLow-Income TractPSTA Bus RoutesLocal RoutesCommuter RoutesExpress RoutesSUNSHINE SKYWAY´Hillsborough CoSource: PSTA2 1 0 2MilesManatee CouI-275GANDY BLVD62NDAVE NEANCLOTE RDE LIVE OAK STKEYSTONE RDEAST LAKE RD"eGULF RDE TARPON AVEMERES BLVDE KLOSTERMAN RDBAY STLANSBROOK PKWYALDERMAN RDNEBRASKA AVECR 611CR 1CURLEW RDÆÀ"e"e"e126TH AVE N!P¯ÀÅaaÅ aa "eÅ "eaa30TH AVE N22ND AVE N"e1ST AVE N1ST AVE SÆÀÅ aa!PTAMPA RDSOLON AVEBAYSHORE BLVDSHORE DR EMAIN STPHILLIPPE PKWYUS HIGHWAY 19 NDREW STDRUID RDBELLEAIR RDSTARKEY RD113TH ST N!P"ePARK BLVD N4TH ST N54TH AVE N62ND AVE N1ST ST N38TH AVE N9TH AVE NÆÀ5TH AVE NCENTRAL AVE34TH ST SPARK ST N58TH ST NSEMINOLE BLVD102ND AVE N34TH ST N28TH ST N46TH AVE N5TH AVE S18TH AVE S31ST ST SMCMULLEN BOOTH RDVIRGINIA STUNION STSUNSET POINT RDDOUGLAS AVEEAST BAY DRSR 590BAYSIDE BRIDGELAKEVIEW RD8TH AVE SW150TH AVE NINDIAN ROCKS RDULMERTON RDWALSINGHAM RD 118TH AVE NDR MARTIN LUTHER KING JR ST N86TH AVE N82ND AVE N70TH AVE N11TH AVE S58TH ST S49TH ST S131ST ST N60TH ST NTYRONE BLVD N26TH AVE S4TH ST SN BETTY LNISLAND WAYMANDALAY AVECOURTNEY CAMPBELL CSWYCOURT STN FT HARRISON AVEWYATT STPinellas Suncoast Transit AuthorityTransit Development PlanFY 2011 - FY 2020I-275Map 4-3:PSTA BusRoute SystemOAKLEAF BLVDNORTHSIDE DRSR 580SR 5909TH AVE NWHITNEY RD142ND AVE NWILCOX RDROSERY RD NEROOSEVELT BLVDDRYER AVE 16TH AVE SEROOSEVELT BLVD125TH ST N16TH ST N 16TH ST NHAMLIN BLVD71ST ST N19TH ST NDUHME RD4TH AVE N64TH ST SPASADENA AVE SBLIND PASS RDPINELLAS BAYWAY SGULF BLVDPINELLAS BAYWAYGULF BLVD
PSTA FacilitiesIn 2005, PSTA moved into its new administration,operation, and maintenance facility located at3201 Scherer Drive in St. Petersburg. This newfacility replaced the operations facilities located on28 th Street South in St. Petersburg and theoperations and administrative facility on 49 thStreet North in mid-county. This facility allowsPSTA to operate from one central location withadditional space for service expansion. The newfacility can accommodate up to 125 administrativepersonnel, 160 maintenance personnel, 600 busoperators, and 300 buses.PSTA has three major transfer terminals, including Williams Park in St. Petersburg, Park Street inClearwater, and Grand Central Station in St. Petersburg. Other transit centers include: Tyrone SquareMall, Gateway Mall, The Shoppes at Park Place, Largo Mall, the 34 th Street Lay-By at PSTA, Tarpon Mall,25 th Way and Roy Hanna Drive, Clearwater Mall, Westfield Countryside Mall, Seminole Mall, and IndianRocks Shopping Center.There are three existing park-and-ride facilities in Pinellas County. Table 4-1 shows the location, condition,use, and site specifications for these three lots. PSTA often takes inventory of these sites and uses thatinformation to determine which park-and-ride facilities are the most successful, as well as which lots requireimprovements.FDOT District seven has identified potential sites in its “Regional Park-and-Ride Lot Plan.” According toFDOT staff, this plan, which was developed prior to the 2001 PSTA TDP, is the most recent documentranking the potential park-and-ride sites. Further discussions with the FDOT District Seven staff alsorevealed that no update for the plan is scheduled in the near future. Table 4-2 shows the top 9 potentialpark-and-ride sites based on this plan. Each of the nine sites in the table is ranked according to a numberof criteria ranging from connectivity to the public transportation system, to safety and other criteria. Aweighted score is determined for each potential site and is commonly referred to as a “utilization” score.FDOT research has shown that the higher the score, the more successful the site will be. Map 4-1 showsthe locations of the existing and potential park-and-ride facilities in Pinellas County.Tindale-Oliver & Associates, Inc.Pinellas Suncoast Transit AuthoritySeptember 2010 4-5 Transit Development Plan
Table 4-1Park-and-Ride Facilities in Pinellas CountyOwner/City Location Spaces Usage Signs Markings Access MaintainedByConditionSt.PetersburgOldsmarLargo22ndAvenue N.at 19thStreetSR 580just westofCommerceUlmerton,East ofStarkeySource: PSTA and FDOT District Seven.29 14 Good Good OK FDOT/PSTA14 0 Good Good OK FDOT/PSTA61 28 Good Good OK PSTA/PSTAGoodGoodGoodDateInspectedFebruary,2010February,2010February,2010TransitRoute #22Route #93Route#300XTable 4-2Potential Park-and-Ride SitesLocationFDOT UtilizationScoreSite Information PSTA Route AccessUS 19/SR 60 0.893 Clearwater Mall #19, 60, 62Alternate US 19/Ulmerton Road 0.875 Largo Mall #18 & 5966 th Street/22 nd Avenue 0.865 Tyrone Square Mall Major Transfer PointUS 19/Tarpon Road 0.865 Strip Shopping Mall #19 & 6683 rd Street/9 th Avenue 0.839 Gateway Mall Major Transfer PointUS 19/Park Boulevard 0.834 Park Side Mall Major Transfer PointUS 19/SR 580 0.834 Westfield Shopping Town Major Transfer PointSR 584/East Lake Road 0.833 Shoppes at Boot Ranch #62, & 93Alternate US 19/Park Boulevard 0.830 Seminole Mall #18, 74, 58Source: FDOT District seven.Bus Fleet InventoryPSTA maintains a bus fleet inventory and replacement schedule to comply with FTA useful life standards.It currently owns a total of 189 revenue service buses and 16 trolleys for a total fleet of 205 revenuevehicles. Fourteen 2010 35-foot Gillig replacement buses have been delivered and will soon be in service.Table 4-3 lists the detailed technical and replacement information of all the bus vehicles for PSTA.Tindale-Oliver & Associates, Inc.Pinellas Suncoast Transit AuthoritySeptember 2010 4-6 Transit Development Plan
Table 4-3PSTA Bus Fleet InventoryManufacturer Year Made Number Length Seats Scheduled ReplacementNew Flyer 1997 14* 35' 30 2010Gillig 1999 8* 40' 40 2011Gillig 2002 4 29' 26 2012Gillig 2001 16 40' 40 2013Gillig 2002 10 40' 40 2014MCI 2003 10 40' 49 2015Gillig 2005 5 29' 26 2015Gillig 2005 8 40' 40 2017Gillig 2005 8 35' 37 2017Gillig 2006 36 40' 40 2018Gillig 2006 12 35' 37 2018Gillig 2007 11 40' 40 2019Gillig 2007 7 35' 37 2019Gillig 2008 15 40' 40 2020Gillig 2008 6 35' 37 2020Gillig (Hybrid BRT) 2009 3 35' 32 2021Gillig (Clean Diesel BRT) 2009 2 35' 32 2021Gillig (Hybrid BRT) 2010 14 35' 32 2022*16 buses will remain in a contingency fleet (14 – 1997 model buses and 2 – 1999 model buses)Note: Shaded vehicles are on order, but have not been completed.TrolleysSource: PSTAManufacturer Year Made Number Length Seats Scheduled ReplacementGillig 2007 3 35' 37 2019Gillig 2008 6 35' 37 2020Gillig (Hybrid) 2009 7 35' 32 2021Tindale-Oliver & Associates, Inc.Pinellas Suncoast Transit AuthoritySeptember 2010 4-7 Transit Development Plan
Other Transit ServicesPSTA is the largest provider of transit services in PinellasCounty. However, there are other public and private firmsoffering services for specific groups of transit users. Table 4-4lists private, non-profit firms that provide service to thetransportation disadvantaged population in Pinellas County.Table 4-5 shows a list of other transit providers that serve thegeneral public. This table also provides selected operatingcharacteristics for those services.Table 4-4Inventory of TD Transit Service ProvidersAgency Address Type of ProviderAgency for Community TreatmentServices, Inc. (ACTS)Alpha House of Pinellas CountyBoley Centers, Inc.City of Gulfport – G.E.M.S Bus ServiceClearwater Yellow CabGirls, Inc.Goodwill Industries, Inc.Gulf Coast Community CareLigthouse of Pinellas, Inc.Louise Graham Regeneration CenterGPTMS – Medicaid TransportationGPTMS – MPO TransportationDisadvantaged ProgramNeighborly Care Network4612 North 56 th StTampa, FL 33610701 5th Ave NSt. Petersburg, FL 33713445 31 st St NSt. Petersburg, FL 337052401 53 rd St SGulfport, FL 3370716617 A. U.S. Highway NClearwater, FL 337647700 61 st St NSt. Petersburg, FL 3378110596 Gandy BlvdSt. Petersburg, FL 3373314041 Icot BlvdClearwater, FL 337606925 112 th Circle N, Suite 103Largo, FL 337332301 Third Ave SSt. Petersburg, FL 337127740 66 th St NPinellas Park, FL 337817740 66 th St. NPinellas Park, FL 3378113790 C 49 th St NClearwater, FL 33762Non-ProfitNon-ProfitNon-ProfitNon-ProfitFor-ProfitNon-ProfitNon-ProfitNon-ProfitNon-ProfitNon-ProfitFor-ProfitFor-ProfitNon-ProfitTindale-Oliver & Associates, Inc.Pinellas Suncoast Transit AuthoritySeptember 2010 4-8 Transit Development Plan
Table 4-4 (continued)Inventory of TD Transit Service ProvidersAgency Address Type of ProviderOperation PAR, Inc.Personal Enrichment Thru Mental HealthServices, Inc.Pinellas Association for RetardedChildren (PARC)Suncoast Center for CommunityMental Health, Inc.Upper Association Pinellas for RetardedCitizens (UPARC)WestcareVan Gogh’s Palette, Inc. dbaVincent HouseCare Ride, LLCWheelchair Transportation ServiceExpress Medical TransportMedfleet Systems, Inc.United CabWheelchair Transport ServiceSource: 2008-2012 Pinellas County Transportation Disadvantaged Service Plan.6655 66 th St NPinellas Park, FL 3378111254 58 th St NPinellas Park, FL 337823190 Tyrone Blvd NSt. Petersburg, FL 337104024 Central Ave, P.O. Box 10970St. Petersburg, FL 337331501 N Belcher Rd, Suite 249Clearwater, FL 337659700 Dr. Martin Luther King Jr. StSt. Petersburg, FL 337024801 78 th Ave NPinellas Park, FL 3378116991 U.S. Highway 19 NClearwater, FL 33764611 Druid Rd, E Suite 704Clearwater, FL 3375616117 U.S. Highway 19 N Suite AClearwater, FL 3376416117 U.S. Highway 19 N Suite AClearwater, FL 3376416117 U.S. Highway 19Clearwater, FL 33764Non-ProfitNon-ProfitNon-ProfitNon-ProfitNon-ProfitNon-ProfitNon-ProfitPrivatePrivatePrivatePrivatePrivateTindale-Oliver & Associates, Inc.Pinellas Suncoast Transit AuthoritySeptember 2010 4-9 Transit Development Plan
Name Type OwnershipSpecialAgreementTable 4-5Inventory of Other Transit Services (Pinellas County)ServiceAreaService PeriodServiceFreq.Clients VehiclesSeatingCapacityDailyRidershipReg. FareSpecial/WheelchairAccessiblePreparedADA PlanCoord.withPSTAThe LooperTrolley (PSTAOperatingSubsidy)Contract w/Bay to BayAves. 5N -11S; Pier to4th StreetSun.-Thurs.10 a.m.- 5 p.m. 15 min.Fri.-Sat.10 a.m.-12 p.m.Tourists,Residents,5Seniors,DisabledMinitrolley:32 326 avg. $0.25Trolley: 48All vehicles arewheelchair No YesaccessibleGulfportExtendedMinibus Service(GEMS)DemandResponseCity ofNoneGulfportCity ofGulfportMon.-Fri.,8:15 a.m. -Varies4:00 p.m.No holidaysResidents,Seniors over55, Disabled1 bus, 1minivan, 1carBuses: 14Minivan: 10Car: 4Approx.75$50 AnnualFee; plus $1per one-waytripBuses & Minivansare wheelchair No NoaccessibleJolley Trolley(PSTAOperatingSubsidy)Sun.-Thurs.10 a.m.- 10 p.m.30 min. All types 9 32 216 $1.75Fri.-Sat.10 a.m.-11 p.m2 vehicles arewheelchair Yes YesaccessibleGulfportTrolleySpecialServicesOperation by City usingPSTA vehicle (FDOTService PlanService DevelopmentFunding)City ofGulfport7:45 a.m. - 9:5060 min. All Types 2 45 55p.m.Blue: 1.75Yes N/A YesRed: FreeCentral AvenueShuttleFixed-The Looper Group, Inc.RouteFixed-City of Clearwater None ClearwaterRouteFixed-RouteThe Looper Group, Inc. N/ACentralAvenue10:00 a.m. –5:00 p.m.15 min. All Types N/A 48 150 avg.* $0.25All vehicles arewheelchairaccessibleNo YesSource: PSTA and other transit providersTindale-Oliver & Associates Pinellas Suncoast Transit AuthoritySeptember 2010 4-10 Transit Development Plan
OPERATING STATISTICSThe current operating budget for FY 2009/10 is $54,872,640. Of this amount, 54.2 percent is generatedfrom ad valorem taxes from the 19 communities participating in the Authority (excluding Belleair Beach,Belleair Shores, Kenneth City, St. Pete Beach, and Treasure Island) and property within unincorporatedPinellas County. St. Pete Beach and Treasure Island, which are not part of the Authority, contract withPSTA for transit services. Approximately 23.4 percent of the budget is from passenger revenues, andanother 18.0 percent of revenue comes from state and federal grants. The remaining 4.5 percent isderived from fuel tax reimbursement & miscellaneous revenue. Table 4-6 compares the FY 2006/07 andFY 2009/10 operating budgets. Compared with the FY 2006/07 budget, the most notable change is thedecrease in ad valorem taxes (21.2%). That decrease is consistent with the recent decrease in propertyvalues occurring throughout Florida and the U.S. Passenger fare revenues increased from $10,070,910 to$12,829,390, a 27.4 percent increase. Figure 4-1 illustrates the FY 2009/10 budget breakdown.Table 4-6Comparison between PSTA’S FY 2006/07 and FY 2009/10 Operating Budget2006/07 2009/10 PercentChangeRevenue SourceRevenueGenerated% of TotalBudgetRevenueGenerated% of TotalBudget2006/07-2009/10Ad Valorem Taxes $37,746,300 67.70% $29,734,820 54.19% -21.2%Passenger Revenue $10,070,910 18.00% $12,829,390 23.38% 27.4%State & Federal Grants $5,699,200 10.20% $9,849,250 17.95% 72.8%Fuel Tax Reimbursement & Misc. Revenue* $2,278,420 4.10% $2,459,180 4.48% 7.9%TOTALS $55,794,830 100% $54,872,640 100.00% -1.7%* Misc. Revenues include: Auxiliary Revenue ($186,000), Non-transportation Revenue ($643,200), Local Beach Trolley ($600,000), Pass-thru Grant ($80,000),and Transfer from Reserves ($350,000), for a total of $1,859,200.Figure 4-1FY 2009/10 Operating Budget by Revenue SourcePassengerRevenue,23.4%FuelTaxReimbursement&MiscellaneousRevenue,4…State&FederalGrants,17.9%AdValoremTaxes,54.2%Tindale-Oliver & Associates, Inc.Pinellas Suncoast Transit AuthoritySeptember 2010 4-11 Transit Development Plan
Fixed-route Service Operating StatisticsTable 4-7 and Figure 4-2 show PSTA fixed-route ridership from FY 1994 through FY 2009. As shown inthe table and figure, ridership exceeded 12 million passenger trips in FY 2007/08. The FY 2008 systemwideaverage passengers per revenue hour was 19.36 and passengers per revenue mile was 1.35.Ridership experienced a slight decrease in 2008/09.Table 4-7Total Fixed-Route RidershipFiscal Year Total Ridership % Change From Previous Year1993/94 7,858,669 4.33%1994/95 7,975,651 1.49%1995/96 8,271,908 3.71%1996/97 8,719,071 5.41%1997/98 9,077,502 4.11%1998/99 9,505,696 4.72%1999/00 9,701,963 2.06%2000/01 9,690,296 -.12%2001/02 9,289,701 -4.13%2002/03 9,487,637 2.22%2003/04 9,701,063 2.16%2004/05 10,226,584* 5.83%2005/06 11,141,770* 8.95%2006/07 11,298,669 1.41%2007/08 12,522,319 10.83%2008/09 11,865,604 -5.24%*Includes Looper ridership of 105,259 and 120,419 in FY 2004/05 and 2005/06, respectively.14,000,000Figure 4-2Total Fixed-Route Ridership12,000,00010,000,0008,000,000TotalRidership6,000,0004,000,0002,000,00002008/092007/082006/072005/062004/052003/042002/032001/022000/011999/001998/991997/981996/971995/961994/951993/94Tindale-Oliver & Associates, Inc.Pinellas Suncoast Transit AuthoritySeptember 2010 4-12 Transit Development Plan
Tables 4-8 and 4-9 include the PSTA ridership analysis for FY 2008 and FY 2009, respectively. Comparedto FY 2006/07, wheelchair passenger ridership increased 5.3 percent, medicaid bus pass ridershipincreased 24.3 percent, and bicycle user ridership increased 23.6 percent, in FY 2007/08. Conversely, thetrend for these rider market segments all decreased in FY 2008/09 except for wheelchair passengerridership.Four Routes, Routes 19, 18, 52, and 4, eachtotal more than 1 million in ridershipannually. These four routes carryapproximately 41 percent of all PSTApassengers in FY 2008/09.Through December of FY 2009/10, Routes1, 66, and 68 have experienced the largestincrease in ridership when compared to thesame period in FY 2008/09. Overallridership has increased slightly over thesame period. PSTA expects to exceed the2008/09 overall ridership level in this current fiscal year.Service FrequencySix (20%) of PSTA's fixed routes (excluding commuter routes, express routes, and community circulators)have peak-hour frequencies of 30 minutes and six (20%) provide peak-hour frequencies of 20 minutes orbetter. The Pinellas Park Shuttle, which serves as a community circulator, operates with servicefrequencies greater than 60 minutes, and Route 32, which provides circulator service in the downtown St.Petersburg area, has a 35-minute service frequency during off-peak hours. The remaining eighteen (60%)fixed routes have 60-minute, peak-hour frequencies. Table 4-10 includes the service profile for PSTA fixedroutes that took effect on June, 2010.FaresPSTA’s current fare structure is presented in Table 4-11. Unlimited Ride Go Cards are also available.They include Daily, 7-Day, and 31-Day Unlimited Ride Go Cards.Senior citizens and persons with disabilities may ride for a reduced cash fare or use a reduced fare GOCard with an original Medicare card or a PSTA Photo ID card. Students may ride for a reduced cash farealso with a PSTA Photo ID card. Passenger fares are an important revenue source for PSTA operationsand the current fare structure was put in place in October 2008.Tindale-Oliver & Associates, Inc.Pinellas Suncoast Transit AuthoritySeptember 2010 4-13 Transit Development Plan
Table 4-8Ridership Analysis FY 2008/09 (October 2008 – September 2009)Reflects Service Changes effective October 5, 2008PASSENGERS REVENUE PASSENGERS REVENUE TOTAL TOTAL WHEELCHAIR WHEELCHAIRBICYCLE BICYCLEMEDICAID MEDICAIDPERCENTPERCENTPER REV. HOUR HOURS PER REV. MILE MILES RIDERSHIP RIDERSHIP PASSENGERS PASSENGERS CHANGE PASSENGERS PASSENGERS CHANGE PASSENGERS PASSENGERSFY 2008/09 FY2008/09 FY 2008/09 FY 2008/09 FY 2008/09 FY 2007/08 FY 2008/09 FY 2007/08 FY 2008/09 FY 2007/08 FY 2008/09 FY 2007/081 1 (Rtes 1 + 22) 6.74 6,622.51 0.48 92,542.7 44,639 92,862 282 388 -27.32% 1,587 2,494 -36.37% 299 1,774 -83.15%4 2 (Rtes 4 + 111) 22.91 43,529.00 1.71 584,789.3 997,170 1,017,677 5,741 4,838 18.66% 24,961 25,044 -0.33% 19,159 26,707 -28.26%5 17.16 11,983.37 1.38 149,250.0 205,660 211,413 2,306 1,469 56.98% 4,068 4,492 -9.44% 4,788 4,900 -2.29%7 17.90 8,222.95 1.44 102,496.2 147,217 192,392 794 878 -9.57% 2,893 3,636 -20.43% 2,674 4,038 -33.78%11 18.54 12,189.14 1.42 158,889.3 225,978 268,438 987 950 3.89% 5,448 7,083 -23.08% 4,234 3,121 35.66%14 21.43 15,818.91 1.68 201,836.5 338,988 374,687 2,229 1,754 27.08% 5,358 6,023 -11.04% 8,471 8,360 1.33%15 18.43 7,225.92 1.30 102,726.6 133,199 189,280 911 1,026 -11.21% 2,818 3,195 -11.80% 3,553 5,077 -30.02%18 23.56 54,527.10 1.93 664,342.8 1,284,813 1,326,886 10,296 9,378 9.79% 38,197 42,917 -11.00% 14,999 18,283 -17.96%19 24.51 61,617.83 1.67 906,649.2 1,510,311 1,513,439 6,053 4,798 26.16% 50,714 57,934 -12.46% 16,735 15,862 5.50%20 15.43 9,394.87 1.05 137,555.8 144,944 161,112 881 702 25.50% 3,743 3,581 4.52% 2,491 3,122 -20.21%23 13.75 15,988.09 1.04 212,157.3 219,798 259,257 1,210 1,340 -9.70% 4,034 5,006 -19.42% 4,251 4,457 -4.62%30* 6.38 2,133.79 0.41 33,053.2 13,603 34,407 24 60 -60.00% 616 1,107 -44.35% 47 408 -88.48%35 20.12 20,641.94 1.92 216,710.1 415,335 415,636 1,642 1,159 41.67% 15,709 15,480 1.48% 7,808 9,445 -17.33%38 15.46 9,579.64 1.04 142,829.5 148,083 162,473 1,065 663 60.63% 5,355 5,155 3.88% 1,742 2,197 -20.71%52 26.56 43,330.74 1.80 639,054.2 1,150,785 1,163,546 6,113 5,171 18.22% 31,669 37,224 -14.92% 18,601 20,508 -9.30%58 9.18 10,885.61 0.51 197,235.0 99,915 135,164 214 230 -6.96% 4,957 6,920 -28.37% 888 980 -9.39%59 19.27 35,672.71 1.31 523,298.2 687,458 691,730 3,131 2,157 45.16% 21,776 21,130 3.06% 7,654 8,742 -12.45%60 41.28 13,956.73 3.38 170,387.8 576,075 600,130 1,632 1,573 3.75% 12,253 15,331 -20.08% 4,596 5,107 -10.01%61 14.99 13,433.67 1.20 167,831.6 201,414 192,709 629 584 7.71% 4,183 4,209 -0.62% 2,936 1,811 62.12%62 3 (Rte 62 +82) 11.72 12,822.78 0.63 236,747.7 150,246 213,536 620 837 -25.93% 7,379 10,562 -30.14% 1,815 2,693 -32.60%66 14.05 17,999.89 0.93 271,478.0 252,881 261,652 1,414 1,457 -2.95% 9,055 11,184 -19.04% 2,193 1,996 9.87%67 18.16 6,836.82 0.98 127,086.3 124,177 122,190 261 262 -0.38% 4,893 5,918 -17.32% 652 505 29.11%68 17.53 5,640.55 1.20 82,643.9 98,889 97,133 368 476 -22.69% 5,060 5,023 0.74% 1,153 544 111.95%73 17.03 7,942.88 1.09 123,781.3 135,238 148,831 767 623 23.11% 3,811 6,048 -36.99% 1,364 1,448 -5.80%74 15.17 33,656.75 1.01 502,985.6 510,458 519,634 4,519 4,873 -7.26% 20,457 22,963 -10.91% 6,030 6,325 -4.66%75 12.69 10,936.08 1.02 136,616.0 138,750 130,793 1,098 692 58.67% 4,434 3,989 -88.19% 1,840 1,636 12.47%76 21.00 6,041.35 1.55 82,078.3 126,845 131,233 318 368 -13.59% 2,685 3,306 -18.78% 725 832 -12.86%78 26.82 8,319.08 2.14 104,493.7 223,103 229,775 1,018 1,193 -14.67% 6,005 7,150 -16.01% 1,732 1,758 -1.48%79 17.83 29,010.86 1.19 434,932.1 517,291 553,922 4,025 4,073 -1.18% 15,169 18,310 -17.15% 8,132 8,573 -5.14%Suncoast Beach Trolley SM +Rt 80 4 18.15 41,780.19 1.09 697,951.4 758,236 782,833 641 634 1.10% 25,125 25,997 114.00% 3,163 3,425 -7.65%SUBTOTAL 20.05 577,741.75 1.41 8,204,429.6 11,581,499 12,194,770 61,189 54,606 12.06% 344,412 388,411 -11.33% 154,725 174,634 -11.40%(75% of AVG) 15.03 1.06Note: Routes 1, 22, 80, 82, 96, and 111 were discontinued on October 4, 2008.1 Route 1 combined with Route 22 which was eliminated. 2 Route 4 absorbed Route 111. 3 Route 62 absorbed Route 82 which was eliminated. 4 Route 80 combined with SCBT.PERCENTCHANGETindale-Oliver & Associates, Inc.Pinellas Suncoast Transit AuthoritySeptember 2010 4-14 Transit Development Plan
Table 4-8 (Cont’d)Ridership Analysis FY 2008/09 (October 2008 – September 2009)Reflects Service Changes effective October 5, 2008SHUTTLE/CIRCULATORROUTE5 Route eliminatedSHUTTLE/CIRCULATOR ROUTESPASSENGERS REVENUE PASSENGERS REVENUE TOTAL TOTAL WHEELCHAIR WHEELCHAIRBICYCLE BICYCLEMEDICAID MEDICAIDPERCENTPERCENTPER REV. HOUR HOURS PER REV. MILE MILES RIDERSHIP RIDERSHIP PASSENGERS PASSENGERS CHANGE PASSENGERS PASSENGERS CHANGE PASSENGERS PASSENGERSFY 2008/09 FY 2008/09 FY 2008/09 FY 2008/09 FY 2008/09 FY 2007/08 FY 2008/09 FY 2007/08 FY 2008/09 FY 2007/08 FY 2008/09 FY 2007/0832 17.32 2,470.27 2.20 19,411.1 42,792 43,404 1,257 628 100.16% 287 364 -21.15% 1,021 1,347 -24.20%444 5.46 2,191.46 0.47 25,664.8 11,968 8,236 256 118 116.95% 48 26 N/A 111 121 N/A11.75 4,661.73 1.21 45,075.9 54,760 51,640 1,513 746 102.82% 335 390 -14.10% 1,132 1,468 -22.89%(75% of AVG) 8.81 0.91PEAK-HOURCOMMUTERROUTESCOMMUTER ROUTESPASSENGERS REVENUE PASSENGERS REVENUE TOTAL TOTAL WHEELCHAIR WHEELCHAIRBICYCLE BICYCLEMEDICAID MEDICAIDPERCENTPERCENTPER REV. HOUR HOURS PER REV. MILE MILES RIDERSHIP RIDERSHIP PASSENGERS PASSENGERS CHANGE PASSENGERS PASSENGERS CHANGE PASSENGERS PASSENGERSFY 2008/09 FY 2008/09 FY 2008/09 FY 2008/09 FY 2008/09 FY 2007/08 FY 2008/09 FY 2007/08 FY 2008/09 FY 2007/08 FY 2008/09 FY 2007/0890 21.04 1,671.64 1.16 30,240.4 35,168 36,032 28 19 47.37% 903 918 -1.63% 379 300 26.33%93 9.68 3,134.02 0.51 59,682.5 30,336 33,873 17 6 183.33% 1,389 932 49.03% 204 141 44.68%96 5 8.19 26.01 0.39 546.0 213 18,753 0 8 -100.00% 5 1,030 -99.51% 0 272 -100.00%97 15.97 2,747.00 1.12 39,085.2 43,856 48,961 116 107 8.41% 1,966 2,447 -19.66% 691 927 -25.46%98 18.53 1,603.17 1.19 24,911.3 29,709 38,119 47 37 27.03% 1,089 1,171 -7.00% 168 199 -15.58%SUBTOTAL 15.17 9,181.84 0.90 154,465.4 139,282 175,738 208 177 17.51% 5,352 6,498 -17.64% 1,442 1,839 -21.59%(75% of AVG) 11.38 0.68EXPRESSROUTEPASSENGERS REVENUE PASSENGERS REVENUE TOTAL TOTAL WHEELCHAIR WHEELCHAIRBICYCLE BICYCLEMEDICAID MEDICAIDPERCENTPERCENTPER REV. HOUR HOURS PER REV. MILE MILES RIDERSHIP RIDERSHIP PASSENGERS PASSENGERS CHANGE PASSENGERS PASSENGERS CHANGE PASSENGERS PASSENGERSFY 2008/09 FY 2008/09 FY 2008/09 FY 2008/09 FY 2008/09 FY 2007/08 FY 2008/09 FY 2007/08 FY 2008/09 FY 2007/08 FY 2008/09 FY 2007/08100 7.32 7,036.31 0.35 146,427.5 51,483 59,826 140 68 105.88% 1,490 1,911 -22.03% 0 0 N/A300 5.23 7,360.42 0.24 159,696.3 38,496 40,285 51 87 -41.38% 1,673 1,228 36.24% 0 0 N/ASUBTOTAL 6.25 14,396.73 0.29 306,123.8 89,979 100,111 191 155 23.23% 3,163 3,139 0.76% 0 0 N/A(75% of AVG) 4.69 0.22Sub-Totals 20.06 591,585.32 1.41 8,403,970.9 11,865,520 12,522,259 62,910 55,529 13.29% 350,099 395,299 -11.43% 157,299 177,941 -11.60%Special Service Revenue** 19.32 IRONMAN 334.50 EVAC 0.0 60TBAR 450 CVB 0.0 31SPCC 8GRAND TOTAL 19.58 606,001.37 1.36 8,710,429.2 11,865,604 12,522,319 63,101 55,684 13.32% 353,262 398,438 -11.34% 157,299 177,941 -11.60%Note: The difference between the Medicaid totals is due to the bus passes being sold as Medicaid not being coded as such. They are coded as 31-day bus passes verified by Rita Hoffman 05/07/09.PERCENTCHANGEPERCENTCHANGEPERCENTCHANGETindale-Oliver & Associates, Inc.Pinellas Suncoast Transit AuthoritySeptember 2010 4-15 Transit Development Plan
Table 4-9Ridership Analysis FY 2009/10 (October 2009 – June 2010)PASSENGERS REVENUE PASSENGERS REVENUE TOTAL TOTALRIDERHSIPWHEELCHAIRWHEELCHAIRBICYCLEBICYCLEMEDICAID MEDICAIDMEDICAIDPER REV. HOUR HOURS PER REV. MILE MILES RIDERSHIP RIDERSHIP PERCENT PASSENGERS WHEELCHAIR PERCENT PASSENGERS BICYCLE PERCENT PASSENGERS PASSENGERS PERCENTCHANGEPASSENGERS CHANGEPASSENGERS CHANGECHANGEFY 2009/10 FY 2009/10 FY 2009/10 FY 2009/10 FY 2009/10 FY 2008/09 FY 2009/10 FY 2008/09FY 2009/10 FY 2008/09FY 2009/10 FY 2008/091 1 (Rtes 1 + 22) 8.16 4,862.32 0.58 68,875.3 39,668 32,792 20.97% 330 209 57.89% 1,280 1,097 16.68% 1,681 31 N/A4 2 (Rtes 4 + 111) 24.50 32,436.17 1.82 436,702.9 794,718 744,541 6.74% 4,314 4,166 3.55% 18,680 18,525 0.84% 81,679 2,056 3872.71%5 18.17 8,971.45 1.45 112,042.4 162,973 151,332 7.69% 1,130 1,780 -36.52% 2,891 2,920 -0.99% 17,524 513 3315.98%7 15.63 6,195.08 1.28 75,506.3 96,838 116,969 -17.21% 424 655 -35.27% 2,327 2,066 12.63% 11,355 288 3842.71%11 19.97 8,953.30 1.51 118,532.0 178,763 167,717 6.59% 800 743 7.67% 3,582 3,900 -8.15% 15,693 315 4881.90%14 23.34 11,656.96 1.81 150,358.4 272,016 254,621 6.83% 1,646 1,575 4.51% 4,448 3,890 14.34% 39,028 685 5597.52%15 21.83 5,294.86 1.51 76,425.5 115,596 97,305 18.80% 912 595 53.28% 2,608 1,944 34.16% 16,887 278 5974.46%18 23.89 41,026.09 1.97 498,367.0 980,221 965,996 1.47% 7,447 7,732 -3.69% 29,491 28,637 2.98% 60,132 1,846 3157.42%19 25.96 45,360.14 1.76 669,579.5 1,177,599 1,125,718 4.61% 4,508 4,480 0.63% 38,459 37,545 2.43% 70,467 1,415 4880.00%20 16.81 7,024.26 1.15 102,821.0 118,103 107,905 9.45% 632 616 2.60% 2,524 2,933 -13.94% 11,209 188 5862.23%23 14.95 12,043.71 1.13 158,979.9 180,097 163,971 9.83% 973 836 16.39% 3,233 2,865 12.84% 20,252 416 4768.27%30* 5.81 1,579.34 0.38 24,462.1 9,180 10,707 -14.26% 26 22 18.18% 587 499 17.64% 378 8 N/A35 24.37 12,504.18 1.94 156,663.5 304,678 305,521 -0.28% 1,556 1,088 43.01% 9,969 11,723 -14.96% 28,518 852 3247.18%38 16.34 7,228.74 1.11 106,559.8 118,103 113,286 4.25% 1,069 720 48.47% 4,496 4,153 8.26% 8,506 142 5890.14%52 28.12 32,495.05 1.92 477,097.2 913,811 858,984 6.38% 4,391 4,681 -6.20% 26,952 23,321 15.57% 71,810 2,132 3268.20%58 9.20 8,194.11 0.52 145,991.9 75,400 75,793 -0.52% 161 173 -6.94% 3,762 3,563 5.59% 2,778 107 2496.26%59 20.90 26,625.69 1.43 390,315.8 556,541 517,182 7.61% 2,632 2,385 10.36% 18,403 16,388 12.30% 33,746 864 3805.79%60 42.40 10,481.94 3.47 128,088.0 444,407 430,230 3.30% 947 1,281 -26.07% 10,344 9,304 11.18% 18,249 341 5251.61%61 15.54 10,074.13 1.24 126,102.8 156,519 149,059 5.00% 662 434 52.53% 3,862 3,143 22.88% 11,721 216 5326.39%62 3 (Rte 62 +82) 12.59 10,159.94 0.72 176,459.0 127,885 111,068 15.14% 418 496 -15.73% 4,761 5,713 -16.66% 6,941 216 3113.43%66 15.51 13,961.46 1.02 213,148.8 216,489 184,308 17.46% 1,366 1,019 34.05% 7,065 6,719 5.15% 9,942 94 10476.60%67 19.53 5,366.02 1.10 95,571.4 104,825 93,587 12.01% 299 174 71.84% 3,692 3,816 -3.25% 2,705 43 6190.70%68 20.01 4,169.28 1.36 61,510.1 83,437 72,550 15.01% 266 288 -7.64% 3,266 3,833 -14.79% 3,770 162 2227.16%73 15.44 6,231.39 1.01 95,627.2 96,212 101,967 -5.64% 524 611 -14.24% 3,060 2,747 11.39% 4,312 179 2308.94%74 16.83 25,077.36 1.13 374,050.0 422,075 380,461 10.94% 3,344 3,456 -3.24% 16,002 15,250 4.93% 29,524 507 5723.27%75 13.53 8,005.84 1.06 102,109.5 108,315 102,609 5.56% 811 852 -4.81% 3,618 3,288 -88.19% 8,629 137 6198.54%76 21.44 4,566.12 1.60 61,012.8 97,893 95,749 2.24% 239 257 -7.00% 1,996 2,063 -3.25% 3,067 43 7032.56%78 28.31 6,168.19 2.22 78,815.6 174,591 167,045 4.52% 592 787 -24.78% 4,505 4,505 0.00% 7,430 144 5059.72%79 19.10 21,764.68 1.30 320,885.3 415,671 382,019 8.81% 2,587 3,002 -13.82% 12,263 10,884 12.67% 36,987 727 4987.62%Suncoast Beach Trolley SM +Rt 80 18.59 30,733.69 1.09 524,689.8 571,229 577,613 -1.11% 785 500 57.00% 19,445 18,777 3.56% 14,056 327 4198.47%SUBTOTAL 21.23 429,211.49 1.49 6,127,350.8 9,113,853 8,658,605 5.26% 45,791 45,613 0.39% 267,571 256,011 4.52% 648,976 15,272 4149.45%(75% of AVG) 15.93 1.12Note: Routes 1, 22, 80, 82, 96, and 111 were discontinued on October 4, 2008.1 Route 1 combined with Route 22 which was eliminated. 2 Route 4 absorbed Route 111. 3 Route 62 absorbed Route 82 which was eliminated. 4 Route 80 combined with SCBT.Tindale-Oliver & Associates, Inc.Pinellas Suncoast Transit AuthoritySeptember 2010 4-16 Transit Development Plan
Table 4-9 (Cont’d)Ridership Analysis FY 2009/10 (October 2009 – June 2010)SHUTTLE/CIRCULATOR ROUTESPASSENGERS REVENUE PASSENGERS REVENUE TOTAL TOTALWHEELCHAIR WHEELCHAIRBICYCLE BICYCLEMEDICAID MEDICAIDSHUTTLE/CIRCULATORRIDERSHIPWHEELCHAIRBICYCLEMEDICAIDROUTEPER REV. HOUR HOURS PER REV. MILE MILES RIDERSHIP RIDERSHIP PERCENT CHANGE PASSENGERS PASSENGERS PERCENT CHANGE PASSENGERS PASSENGERS PERCENT CHANGE PASSENGERS PASSENGERS PERCENT CHANGEFY 2009/10 FY 2009/10 FY 2009/10 FY 2009/10 FY 2009/10 FY 2008/09 FY 2009/10 FY 2008/09 FY 2009/10 FY 2008/09 FY 2009/10 FY 2008/0932 19.34 1,857.41 2.46 14,587.0 35,931 31,010 15.87% 1,026 966 6.21% 206 216 -4.63% 4,137 97 4164.95%444 6.08 1,712.42 0.55 18,823.8 10,406 8,704 19.55% 76 223 -65.92% 7 41 N/A 575 8 7087.50%(75% of AVG) 9.74 1.0412.98 3,569.83 1.39 33,410.8 46,337 39,714 16.68% 1,102 1,189 -7.32% 213 257 -17.12% 4,712 105 4387.62%COMMUTER ROUTESPEAK-HOUR PASSENGERS REVENUE PASSENGERS REVENUE TOTAL TOTALWHEELCHAIR WHEELCHAIRBICYCLE BICYCLEMEDICAID MEDICAIDCOMMUTER PER REV. HOUR HOURS PER REV. MILE MILES RIDERSHIP RIDERSHIPRIDERSHIPWHEELCHAIRBICYCLEMEDICAIDPERCENT CHANGE PASSENGERS PASSENGERS PERCENT CHANGE PASSENGERS PASSENGERS PERCENT CHANGE PASSENGERS PASSENGERS PERCENT CHANGEROUTES FY 2009/10 FY 2009/10 FY 2009/10 FY 2009/10 FY 2009/10 FY 2008/09 FY 2009/10 FY 2008/09 FY 2009/10 FY 2008/09 FY 2009/10 FY 2008/0990 23.93 1,250.23 1.32 22,620.0 29,919 25,826 15.85% 66 16 312.50% 676 647 4.48% 2,593 11 N/A93 8.43 2,418.58 0.46 44,457.3 20,387 23,784 -14.28% 32 12 166.67% 1,205 1,068 12.83% 791 7 N/A96 5 0.00 0.00 0.00 0.0 0 213 -100.00% 0 0 #DIV/0! 0 5 -100.00% 0 0 N/A97 15.95 2,070.49 1.13 29,157.3 33,027 33,335 -0.92% 82 87 -5.75% 1,396 1,451 -3.79% 2,737 56 4787.50%98 17.41 1,114.47 1.04 18,681.5 19,400 22,474 -13.68% 30 30 0.00% 503 812 -38.05% 769 17 4423.53%SUBTOTAL 14.99 6,853.77 0.89 114,916.1 102,733 105,632 -2.74% 210 145 44.83% 3,780 3,983 -5.10% 6,890 91 7471.43%(75% of AVG) 11.24 0.675Route eliminatedPASSENGERS REVENUE PASSENGERS REVENUE TOTAL TOTALWHEELCHAIR WHEELCHAIRBICYCLE BICYCLEMEDICAID MEDICAIDRIDERSHIPWHEELCHAIRBICYCLEEXPRESS PER REV. HOUR HOURS PER REV. MILE MILES RIDERSHIP RIDERSHIP PERCENT CHANGE PASSENGERS PASSENGERS PERCENT CHANGE PASSENGERS PASSENGERS PERCENT CHANGE PASSENGERS PASSENGERSROUTE FY 2009/10 FY 2009/10 FY 2009/10 FY 2009/10 FY 2009/10 FY 2008/09 FY 2009/10 FY 2008/09 FY 2009/10 FY 2008/09 FY 2009/10 FY 2008/09100 7.50 5,249.59 0.36 108,166.6 39,368 38,601 1.99% 152 79 92.41% 1,922 927 107.34% 0 0 N/A300 4.94 5,491.51 0.23 119,197.2 27,134 29,580 -8.27% 137 39 251.28% 1,154 1,172 -1.54% 0 0 N/ASUBTOTAL 6.19 10,741.10 0.29 227,363.8 66,502 68,181 -2.46% 289 118 144.92% 3,076 2,099 46.55% 0 0 N/A(75% of AVG) 4.64 0.22Sub-Totals 20.71 450,376.19 1.43 6,503,041.53 9,329,425 8,872,132 5.15% 47,392 47,065 0.69% 274,640 262,350 4.68% 660,578 15,468 4170.61%Special Service Revenue** 84MEDICAIDPERCENT CHANGEGRAND TOTAL 20.71 450,376.19 1.43 6,503,041.53 9,329,425 8,872,216 5.15% 47,392 47,065 0.69% 274,640 262,350 4.68% 660,578 15,468 4170.61%Note: The difference between the Medicaid totals is due to the bus passes being sold as Medicaid not being coded as such. They are coded as 31-day bus passes verified by Rita Hoffman 05/07/09.Tindale-Oliver & Associates, Inc.Pinellas Suncoast Transit AuthoritySeptember 2010 4-17 Transit Development Plan
Table 4-10Service Profile for Fixed Routes – Effective June 6, 2010PSTA Daily Route Miles Daily Route Hours Service Headway Service Period AM/PM Vehicle RequirementsFixed Route No. M-TH FRI SAT Sun M-TH FRI SAT SUN M-TH FRI SAT SUN M-TH FRI SAT SUNM-FPeakM-F OffPeak SAT SUN1 314.447 314.447 298.047 None 21.18 21.18 22.40 None 60 min. 60 min. 60 min. None 6:35/7:25 6:35/7:25 6:45/7:25 None 1 1 1 -4 2167.820 2167.820 1215.925 521.005 152.58 152.58 84.75 33.16 15 min. 15 min. 30 min.30/60min. 5:25/10:55 5:25/10:555:15/10:45 7:15/6:45 10 10 5 35 605.407 605.407 368.134 201.400 43.58 43.58 29.00 12.42 30/60 min. 30/60 min. 60 min. 90 min. 5:30/8:30 5:30/8:30 5:30/8:25 7:15/7:00 4 2 2 17 312.742 312.742 291.218 323.669 26.05 26.05 21.85 22.20 60 min. 60 min. 60 min. 60 min. 5:45/8:10 5:45/8:10 5:45/8:00 5:45/8:00 1 1 2 311 583.779 583.779 350.247 161.596 41.20 41.20 25.00 10.92 60 min. 60 min. 60 min. 120 min. 6:00/7:30 6:00/7:30 6:00/6:10 7:50/6:05 3 3 2 114 712.058 712.058 689.326 203.056 51.16 51.16 49.50 13.00 30 min. 30 min. 30 min. 90 min. 5:40/8:50 5:40/8:50 5:40/8:50 6:45/7:05 5 5 3 115 321.960 321.960 330.283 215.204 21.15 21.15 22.35 16.14 60 min. 60 min. 60 min. 60 min. 5:25/8:40 5:25/8:40 5:48//8:25 5:48//8:25 2 2 1 -18 2530.036 2530.036 1753.111 709.741 193.36 193.36 124.08 50.66 20/30 min. 20/30 min. 30 min. 60 min 4:55/11:55 4:55/11:555:15/10:30 6:10/7:50 14 8 8 419 3351.569 3351.569 2519.148 894.053 210.50 210.50 164.50 59.25 20/30 min. 20/30 min. 30 min. 60 min 5:15/11:25 5:15/11:255:10/10:35 6:20/7:05 15 9 10 520 442.740 442.740 442.740 366.647 28.08 28.08 28.08 23.25 60 min. 60 min. 60 min. 60 min. 5:25/7:10 5:25/7:10 5:25/7:10 7:20/6:10 2 2 2 223 762.102 762.102 747.329 172.932 54.66 54.66 52.92 10.00 30 min. 30 min. 30 min. 90 min. 5:20/8:30 5:20/8:30 5:20/8:30 8:20/5:30 3 3 5 1(7trip/day)(7trip/day)(7trip/day) 5:15/8:40 5:15/8:40 5:15/8:4030 144.818 144.818 141.014 None 8.36 8.36 8.28 None 60 min. 60 min. 60 min. None 3:05/6:32 3:05/6:32 3:05/6:32 None 1 1 2 -32 84.676 84.676 84.676 None 8.75 8.75 8.75 None 35 min. 35 min. 35 min. None 8:55/5:00 8:55/5:00 8:55/5:00 None 1 1 1 -38 458.976 458.976 456.321 277.215 29.44 29.44 29.96 17.46 60 min. 60 min. 60 min. 60 min. 5:35/9:45 5:35/9:45 6:00/8:45 7:45/6:30 3 3 3 -52 2314.188 2314.188 975.034 728.728 152.66 152.66 63.08 48.38 30 min. 30 min. 60 min. 60 min. 4:45/12:00 4:45/12:00 4:55/9:45 7:05/7:50 10 10 4 458 587.191 587.191 514.198 476.120 33.88 33.88 26.25 24.34 60 min. 60 min. 60 min. 60 min. 5:25/7:20 5:25/7:20 5:40/7:15 5:40/7:15 3 2 2 259 1946.693 1946.693 756.082 756.082 127.78 127.78 46.24 45.04 20/30 min. 20/30 min. 60 min. 60 min. 5:10/9:40 5:10/9:40 5:25/9:50 5:20/9:18 10 6 3 360 583.083 583.083 415.360 350.992 45.30 45.30 31.92 25.60 20/30 min. 20/30 min. 30 min. 30 min. 5:05/11:18 5:05/11:18 5:00/9:39 7:25/9:23 3 2 2 261 557.980 557.980 546.090 324.864 42.92 42.92 42.34 21.58 60 min. 60 min. 60 min. 60/90 min 5:25/8:15 5:25/8:15 5:25/8:15 7:20/6:35 3 3 3 262 935.276 935.276 491.384 None 53.84 53.84 26.34 None 60 min. 60 min. 90 min. None 5:05/9:20 5:05/9:20 6:40/7:30 None 4 4 2 -66 1175.245 1175.245 914.410 375.575 68.50 68.50 56.92 22.25 60 min. 60 min. 60 min. 120 min. 5:10/8:05 5:10/8:05 5:10/8:05 7:55/6:10 6 6 4 267 465.561 465.561 465.612 None 25.94 25.94 26.34 None 60 min. 60 min. 60 min. None 6:00/6:50 6:00/6:50 6:00/6:50 None 2 2 2 -68 259.214 259.214 264.828 239.190 14.72 14.72 17.75 15.92 60 min. 60 min. 60 min. 60 min. 6:10/9:40 6:10/9:406:00/10:45 6:45/9:50 1 1 1 173 499.663 499.663 364.713 None 31.78 30.80 18.66 None 60 min. 60 min. 120 min. None 5:50/7:15 5:50/7:15 5:55/7:05 None 3 3 2 -74 1968.199 1968.199 682.236 538.460 126.58 126.58 44.00 32.25 20/30 min. 20/30 min. 60 min. 60 min. 5:05/9:35 5:05/9:35 5:45/8:35 8:15/6:50 11 6 3 375 409.067 409.067 385.011 390.766 31.12 31.12 30.84 28.86 60 min. 60 min. 60 min. 60 min. 5:15/8:20 5:15/8:20 7:05/8:35 6:25/7:55 1 1 1 476 319.067 319.067 287.175 None 22.42 22.42 20.58 None 60 min. 60 min. 60 min. None 5:55/6:50 5:55/6:50 7:00/6:45 None 2 2 2 -78 432.511 432.511 262.073 157.440 29.20 29.20 18.92 10.42 30/60 min. 30/60 min. 60 min. 75 min. 6:10/7:50 6:10/7:50 6:25/7:50 7:50/5:10 3 1 1 179 1434.024 1434.024 792.974 484.594 99.64 99.64 52.92 30.86 30 min. 30 min. 60 min. 60 min. 5:30/8:40 5:30/8:40 5:35/7:55 7:50/6:50 7 7 4 3444 103.627 103.627 None None 9.00 9.00 None None 105 min. 105 min. None None 9:00/5:35 9:00/5:35 None None 1 1 - -SUB-TOTAL FIXEDROUTE 26783.719 26783.719 17804.699 8869.329 1,805.33 1,804.35 1,194.52 573.96 135 108 83 48Tindale-Oliver & Associates, Inc.Pinellas Suncoast Transit AuthoritySeptember 2010 4-18 Transit Development Plan
Table 4-10 (Cont’d)Service Profile for Fixed Routes – Effective June 6, 2010Commuter RoutesPSTA Daily route Miles Daily Route Hours Service Trips Service Period AM/PM Vehicle RequirementsM-F OffCommuter Route No. M-TH FRI SAT Sun M-TH FRI SAT SUN M-TH FRI SAT SUN M-TH FRI SAT SUN M-F Peak Peak SAT SUN7:05/9:35 7:05/9:35 7:05/9:35 7:05/9:3590 125.770 125.770 125.770 125.770 6.00 6.00 6.00 6.00 4 Trips 4 Trips 4 Trips 4 Trips 4:00/6:10 4:00/6:10 4:20/6:30 4:20/6:30 1 - 1 15:45/10:00 5:45/10:0093 332.713 332.713 None None 16.64 16.64 None None 6 Trips 6 Trips None None 2:30/7:15 2:30/7:15 None None 2 - - -5:15/9:05 5:15/9:0597 250.934 250.934 None None 14.92 14.92 None None 8 Trips 8 Trips None None 3:05/6:30 3:05/6:30 None None 1 - - -5:45/7:55 5:45/7:5598 171.196 171.196 None None 9.50 9.50 None None 5 Trips 5 Trips None None 3:50/5:40 3:50/5:40 None None 1 - - -SUB_TOTAL COMMUTER 880.613 880.613 125.770 125.770 47.06 47.06 6.00 6.00 5 0 1 1Express RoutesPSTA Daily route Miles Daily Route Hours Service Headway Service Period AM/PM Vehicle RequirementsM-F OffCommuter Route No. M-TH FRI SAT Sun M-TH FRI SAT SUN M-TH FRI SAT SUN M-TH FRI SAT SUN M-F Peak Peak SAT SUN100X 606.504 606.504 None None 30.00 30.00 None None 30/120 min. 30/120 min. None None 5:20/7:40 5:20/7:40 None None 3 1 - -300X 716.785 716.785 None None 34.08 34.08 None None 30/120 min. 30/120 min. None None 6:00/7:55 6:00/7:55 None None 4 1 - -SUB_TOTAL COMMUTER 1323.289 1323.289 0.000 0.000 64.08 64.08 0.00 0.00 7 2 0 0PSTA Extended Nitght Daily Route Miles Daily Route Hours Service Headway Service Period AM/PM Vehicle Requirements& Trolley Service M-TH FRI SAT SUN M-TH FRI SAT SUN M-TH FRI SAT SUN M-TH FRI SAT SUN M-F PeakM-F OffPeak Sat SUN35 606.915 723.111 727.122 606.915 45.25 54.00 54.00 45.25 30 min. 30 min. 30 min. 30 min. 5:50/9:15 5:50/11:55 5:50/11:55 5:50/9:15 3 3 3 3Suncoast Beach Trolley 2097.735 2283.442 2283.472 2097.712 118.59 128.16 128.16 118.59 30 min. 30 min. 30 min. 30 min. 5:15/11:10 5:15/12:25 5:15/12:25 5:15/11:10 7 7 7 7SUB_TOTAL TROLLEY 2704.650 3006.553 3010.594 2704.627 163.84 182.16 182.16 163.84 10 10 10 10GRAND TOTAL 31,692.271 31,994.174 20,941.063 11,699.726 2,080.31 2,097.65 1,382.68 743.80 157 120 94 59Tindale-Oliver & Associates, Inc.Pinellas Suncoast Transit AuthoritySeptember 2010 4-19 Transit Development Plan
Table 4-11PSTA FARE STRUCTURE (EFFECTIVE 10-05-08)Child (5 years and under except on 100X & 300X) ..................................................................................... FreeFull Cash Fare ........................................................................................................................................ $ 1.75Special Citizen Reduced Cash Fare with ID* ............................................................................................ $ .85Student Reduced Cash Fare with ID* ....................................................................................................... $ 1.25Route 100X and 300X Premium Cash Fare *** ........................................................................................ $ 3.00Daily Full Fare Unlimited Ride GO Card ................................................................................................... $ 4.00Daily Reduced Fare Unlimited Ride GO Card .......................................................................................... $ 2.007-DayUnlimited Ride GO Card .................. .............................................................................................. $ 20.0031-Day Unlimited Ride GO Card ............................................................................................................... $ 55.0031-Day Reduced Fare Unlimited Ride GO Card*………. .......................................................................... $ 35.0020-Ride Premium GO Card (Routes 100X & 300X)*** ............................................................................. $ 48.00Premium Cash Fare .................................................................................................................................. $ 3.00Special Citizen Reduced Premium Cash Fare* ........................................................................................ $ 1.50Passport ........................................................................................................................................... $ 85.007 -Day Youth Platinum Pass .................................................................................................................. $ 12.50Summer Youth Haul Pass .................................................................................................................... $ 35.00Demand Response Cash Fare** ............................................................................................................... $ 3.501-Ride Punch Ticket .................................................................................................................................. $ 3.0010-Ride Demand Response Punch Ticket** ............................................................................................. $ 30.00*Proper ID must be shown prior to paying a reduced fare or using a reduced fare GO Card. Students are not eligible for reduced fare GO Cards. PSTA photo IDcards can be obtained at a PSTA Customer Service Center, as well as at selected PSTA ticket outlets for $2.50.**Demand Response Service for people who, because of their disability, are unable to independently use the regular, accessible PSTA buses. Certification andreservations are required.***Medicare Cardholders and Senior/Disabled Citizens with PSTA issued Photo ID may pay reduced cash fare of $0.75 on select trips. Students are not eligiblefor this discount and reduced fare GO Cards will not be accepted.Good for unlimited travel for an entire calendar month on all PSTA and HART buses and trolleys.PSTA Youth ID required except for elementary age school children.Tindale-Oliver & Associates, Inc.Pinellas Suncoast Transit AuthoritySeptember 2010 4-20 Transit Development Plan
Demand-Response Transportation Operating StatisticsDemand-response trip volumes increased from 189,314 one-way passenger trips in FY 1993/94 to 228,463one-way passenger trips in FY 2008/09 (a 20.7 percent increase). Table 4-12 and Figure 4-3 reflect thechange in total demand-response trip volume over time.Table 4-12Change In Demand Response Trip VolumeFiscal Year Total Ridership % Change From Previous Year1993/94 189,314 + 4.3%1994/95 166,711 -11.9%1995/96 179,346 + 7.58%1996/97 183,367 + 2.24%1997/98 192,236 + 4.84%1998/99 237,305 +23.44%1999/00 249,437 + 5.11%2000/01 242,353 - 2.84%2001/02 239,777 -1.06%2002/03 242,383 +1.09%2003/04 257,560 +6.26%2004/05 255,413 -0.08%2005/06 258,714 +1.26%2006/07 256,309 -0.91%2007/08 239,754 -6.48%2008/09 228,463 -5.23%300,000Figure 4-3Change in Demand-Response Trip Volume250,000Total Ridership200,000150,000100,00050,00001993/941994/951995/961996/971997/981998/991999/002000/012001/022002/032003/042004/052005/062006/072007/082008/09Tindale-Oliver & Associates, Inc.Pinellas Suncoast Transit AuthoritySeptember 2010 4-21 Transit Development Plan
PSTA budgeted $4.3 million in FY 2008/09 for demand-response service, which is approximately 7.7percent of the PSTA annual operating budget. Table 4-13 shows PSTA operational costs for fixed-routeand demand-response service for FY 1994/95 to FY 2008/09. As shown in that table, unit costs for bothservice types increased during the noted period.Table 4-14 and Figure 4-4 show the fixed-route, demand-response, and combined ridership for FY 1993/94through FY 2008/09. Although both service types experienced ridership growth during the given period, thefixed-route ridership increase is more significant than that of demand-response service. Combinedridership increased approximately 50.3 percent from FY 1993/94 to FY 2008/09.Tindale-Oliver & Associates, Inc.Pinellas Suncoast Transit AuthoritySeptember 2010 4-22 Transit Development Plan
Table 4-13PSTA Cost per Passenger Trip by Fiscal Year (FY 1994/95 – 2008/09).Fiscal Year System Total Expenses Total Trips Unit Cost per Trip1994/95 FIXED ROUTE $23,868,898 7,975,651 $2.99DEMAND RESPONSE $2,354,506 166,711 $14.12TOTAL SYSTEM $26,223,404 8,142,362 $3.221995/96 FIXED ROUTE $24,214,840 8,271,908 $2.93DEMAND RESPONSE $1,707,829 179,346 $9.52TOTAL SYSTEM $25,922,669 8,451,254 $3.071996/97 FIXED ROUTE $24,136,823 8,719,071 $2.77DEMAND RESPONSE $1,865,047 183,637 $10.16TOTAL SYSTEM $26,001,870 8,902,708 $2.921997/98 FIXED ROUTE $24,483,123 9,077,502 $2.70DEMAND RESPONSE $2,077,432 192,236 $10.81TOTAL SYSTEM $26,560,555 9,269,738 $2.871998/99 FIXED ROUTE $24,155,732 9,505,696 $2.54DEMAND RESPONSE $3,090,457 237,305 $13.02TOTAL SYSTEM $27,246,189 9,743,001 $2.801999/00 FIXED ROUTE $26,369,717 9,701,963 $2.72DEMAND RESPONSE $3,394,065 249,437 $13.61TOTAL SYSTEM $29,763,782 9,951,400 $2.992000/01 FIXED ROUTE $28,706,597 9,690,296 $2.96DEMAND RESPONSE $3,664,119 242,353 $15.12TOTAL SYSTEM $32,370,716 9,932,649 $3.262001/02 FIXED ROUTE $29,917,237 9,289,701 $3.22DEMAND RESPONSE $3,808,034 239,777 $15.88TOTAL SYSTEM $33,725,271 9,529,478 $3.542002/03 FIXED ROUTE $32,832,830 9,487,637 $3.46DEMAND RESPONSE $4,089,596 242,383 $16.87TOTAL SYSTEM $36,922,426 9,730,020 $3.792003/04 FIXED ROUTE $35,676,304 9,701,063 $3.68DEMAND RESPONSE $4,375,490 257,560 $16.99TOTAL SYSTEM $40,051,794 9,958,623 $4.022004/05 FIXED ROUTE $37,982,193 10,226,584 $3.71DEMAND RESPONSE $4,319,666 255,413 $16.91TOTAL SYSTEM $42,301,859 10,481,997 $4.042005/06 FIXED ROUTE $46,025,915 11,021,351 $4.18DEMAND RESPONSE $4,385,549 258,714 $16.95TOTAL SYSTEM $50,411,464 11,280,065 $4.472006/07 FIXED ROUTE $48,418,065 11,298,312 $4.29DEMAND RESPONSE $4,597,036 256,309 $17.94TOTAL SYSTEM $53,015,101 11,554,621 $4.592007/08 FIXED ROUTE $50,981,021 12,522,259 $4.07DEMAND RESPONSE $4,305,330 239,754 $17.96TOTAL SYSTEM $55,286,351 12,762,013 $4.332008/09 FIXED ROUTE $51,491,018 11,865,520 $4.29DEMAND RESPONSE $4,178,338 228,648 $18.29TOTAL SYSTEM $55,669,356 12,094,168 $4.60Expenses include purchased transportation costs.Tindale-Oliver & Associates, Inc.Pinellas Suncoast Transit AuthoritySeptember 2010 4-23 Transit Development Plan
Table 4-14Total PSTA Ridership FY 1993/94 – 2008/09Fiscal Year Fixed RouteDemandResponseCombinedTotalPercentChange1993/94 7,858,669 189,314 8,047,983 N/A1994/95 7,975,651 166,711 8,142,362 1.17%1995/96 8,271,908 179,346 8,451,254 3.79%1996/97 8,719,071 183,637 8,902,708 5.34%1997/98 9,077,502 192,236 9,269,738 4.12%1998/99 9,505,696 237,305 9,743,001 5.11%1999/00 9,701,963 249,437 9,951,400 2.14%2000/01 9,690,296 242,353 9,932,649 -0.19%2001/02 9,289,701 239,777 9,529,478 -4.06%2002/03 9,487,637 242,383 9,730,020 2.10%2003/04 9,701,063 257,560 9,958,623 2.35%2004/05 10,226,584 255,413 10,481,997 5.26%2005/06 11,141,770 258,714 11,400,484 8.76%2006/07 11,298,312 256,309 11,554,621 1.35%2007/08 12,522,259 239,754 12,762,013 10.45%2008/09 11,865,520 228,463 12,093,983 -5.23%TOTALS 156,333,602 3,618,712 159,952,314 50.27%Figure 4-4Total PSTA Ridership FY1993/94 – 2008/0914,000,00012,000,00010,000,0008,000,0006,000,000Fixed RouteDemand Response4,000,0002,000,0000Tindale-Oliver & Associates, Inc.Pinellas Suncoast Transit AuthoritySeptember 2010 4-24 Transit Development Plan
PERFORMANCE EVALUATION AND TRENDSA trend analysis of critical performance indicators was conducted to examine the performance of PSTAfixed-route service over time. Data were compiled from the National Transit Database (NTD) reports forfiscal years 2005 to 2009. This analysis includes statistics and tables that present selected performanceindicators, and effectiveness and efficiency measures for the selected time period. Highlights of the trendanalysis are presented below, while summary results are provided at the conclusion of this section.Three categories of indicators were analyzed for the performance evaluation and trend analysis. Theseinclude:Performance Indicators – these indicators show quantity of service supply, passenger and fare revenuegeneration, and resource input.Effectiveness Measures – these measures indicate the extent to which the service is effectivelyprovided.Efficiency Measures – these measures indicate the extent to which cost efficiency is achieved.Performance IndicatorsThe performance indicators are used to gauge the overall system operating performance. Table 4-15shows the selected performance indicators from FY 2005 to FY 2009.Table 4-152005-2009 Performance Indicators, PSTA Trend AnalysisPerformance Indicators 2005 2006 2007 2008 2009% Change2005-2009Passenger Trips (000) 10,204 11,142 11,407 12,614 11,866 16.29%Passenger Miles (000) 47,881 54,078 55,361 60,392 61,549 28.55%Vehicle Miles (000) 9,131 9,666 10,248 10,643 9,923 8.67%Revenue Miles (000) 8,298 8,551 8,970 9,282 8,710 4.97%Total Operating Expense (000) $37,982 $46,025 $48,418 $50,981 $51,228 34.87%Passenger Fare Revenue (000) $8,252 $9,045 $10,718 $11,299 $11,501 39.37%Vehicles Operated in Maximum Service 147 161 171 173 170 15.65%The following is a summary of the trends that are evident among the performance indicators shown inTable 4-15.Tindale-Oliver & Associates, Inc.Pinellas Suncoast Transit AuthoritySeptember 2010 4-25 Transit Development Plan
Total passenger trips for PSTA increased from 10,204,000 in FY 2005 to 11,866,000 in FY 2009, anincrease of 17.6 percent. The highest number of passenger trips occurred in FY 2008. In addition,passenger miles also increased from 47,881,000 to 61,549,000, an increase of 28.6 percent.Total vehicle miles of service increased from 9,131,000 miles in FY 2005 to 9,923,000 miles in FY2009, an increase of 8.7 percent. During the same time period, revenue miles increased by 5.0 percentfrom 8,298,000 miles to 8,710,000 milesTotal operating expenses increased from $37,982,000 in FY 2005 to $51,228,000 in FY 2009, anincrease of 34.9 percent. This is consistent with the expanded hours of service and route expansionduring the same period.Passenger fare revenue increased from $8,252,000 in FY 2005 to $11,501,000 in FY 2009, anincrease of 39.4 percent. The number of vehicles operated in maximum service increased by 15.7 percent, from 147 in FY 2005to 170 in FY 2009.Effectiveness MeasuresTable 4-16 presents four categories of effectiveness measures that include service supply, serviceconsumption, quality of service, and availability.Table 4-162005-2009 Effectiveness Measures, PSTA Trend Analysis% Change2005 2006 2007 2008 2009Effectiveness Measures2005-2009SERVICE SUPPLYVehicle Miles Per Capita 10.35 10.96 11.93 12.32 11.71 13.14%SERVICE CONSUMPTIONPassenger Trips Per Capita 11.44 12.5 13.15 14.50 14.01 22.47%Passenger Trips Per Revenue Mile 1.22 1.29 1.26 1.35 1.36 11.47%Passenger Trips Per Revenue Hour 17.89 18.91 18.54 19.36 19.58 9.45%QUALITY OF SERVICEAverage Age of Fleet 6.07 4.57 4.79 4.40 4.49 -26.03%Number of System Failures 2,988 2,396 2,220 2,109 1,922 -35.68%Revenue Miles Between Failures 2,777.1 3,568.7 4,040.5 4,401.7 4,532.0 63.19%AVAILABILITYWeekday Span of Service (in hours) 20.75 20.75 21.00 21.00 21.00 1.01%Tindale-Oliver & Associates, Inc.Pinellas Suncoast Transit AuthoritySeptember 2010 4-26 Transit Development Plan
The following is a summary of the trends that are evident among the effectiveness measures shown inTable 4-16. Vehicle miles per capita increased by 13.1 percent from FY 2005 to FY 2009.Passenger trips per capita increased from 11.44 in FY 2005 to 14.01 in FY 2009, an overall increase of22.5 percent.Passenger trips per revenue mile increased from 1.22 in FY 2005 to 1.36 in FY 2009, an increase of11.5 percent.Passenger trips per revenue hour increased from 17.89 in FY 2005 to 19.58 in FY 2009, an increase of9.5 percent.The number of system failures decreased from 2,777 in FY 2005 to 1,922 in FY 2009, thereby resultingin an increase in revenue miles between failures of 63.2 percent during this time.Weekday span of service had a marginal increase of 1.0 percent, from 20.75 hours per day to 21 hoursper day.Efficiency MeasuresTable 4-17 presents three categories of efficiency measures that include cost efficiency, operating ratios,and average fare.Table 4-172005-2009 Efficiency Measures, PSTA Trend Analysis% Change2005 2006 2007 2008 2009Efficiency Measures2005-2009COST EFFICIENCYOperating Expense Per Passenger Trip $3.82 $3.69 $4.29 $4.02 $4.32 13.02%Operating Expense Per Passenger Mile $0.80 $0.75 $0.87 $0.83 $0.83 4.04%Operating Expense Per Revenue Mile $4.64 $4.76 $5.40 $5.42 $5.88 26.75%Maintenance Expense Per Revenue Mile $0.90 $0.82 $1.01 $0.86 $0.90 0.00%OPERATING RATIOSFarebox Recovery 21.51 20.20 22.36 22.44 22.45 4.37%FAREAverage Fare $0.82 $0.75 $0.96 $0.90 $1.04 26.83%The following is a summary of the trends that are evident among the efficiency measures presented inTable 4-17.Tindale-Oliver & Associates, Inc.Pinellas Suncoast Transit AuthoritySeptember 2010 4-27 Transit Development Plan
Operating expense per passenger trip increased from $3.82 in FY 2005 to $4.32 in FY 2009, anincrease of 13.0 percent.Operating expense per passenger mile increased from $0.80 in FY 2005 to $0.83 in FY 2009, anincrease of 4.0 percent.Operating expense per revenue mile increased from $4.64 in FY 2005 to $5.88 in FY 2009, an increaseof 26.8 percent. Maintenance expense per revenue mile did not change between FY 2005 and FY 2009. Farebox recovery experienced a slight increase at 4.4 percent from FY 2005 to FY 2009.The average fare increased from $0.82 in FY 2005 to $1.04 in FY 2009, an increase of 26.8 percent.This trend is due to fare increases that took effect on October 1, 2006, and October 5, 2008.Summary Results of Trend AnalysisThe trend analysis is only one aspect of transit performance evaluation. However, when combined with thepeer review analysis, the results provide a starting point for understanding the strengths and weaknessesof a transit system’s performance over time and compared to other systems with similar characteristics.This section identifies strengths and opportunities of PSTA based on the trend analysis. Strengths areindicated in the trend analysis when the trend over the analysis period is positive in terms of transitperformance or negative in regard to costs.Service Consumption - Passenger trips per capita, passenger trips per revenue mile, and passenger tripsper revenue hour all increased. This shows that there are more people accessing the system incomparison to the amount of service being supplied. This suggests that the additional routes and servicehours being provided have been successful in attracting additional ridership.Service Supply - Vehicle miles per capita (service supply) has increased through FY 2008 and declinedwith service reductions in FY 2009.Quality of Service - This area is also indicated as a strength. The number of vehicle system failures hasdecreased substantially, which has significantly increased the number of revenue miles operated betweenfailures. In addition, the considerable reduction in average age of fleet over time indicates that PSTA hasbeen maintaining a healthy bus replacement schedule.Tindale-Oliver & Associates, Inc.Pinellas Suncoast Transit AuthoritySeptember 2010 4-28 Transit Development Plan
Cost Efficiency - This is indicated as an opportunity, since operating expense per passenger trip, operatingexpense per passenger mile, and operating expense per revenue mile all increased. In this case,increases in cost are directly related to increases in service, particularly in 2006 and 2007. PSTA iscommitted to working on improving the efficiency of service by restructuring or discontinuing services thatare not cost-effective. Table 4-18 summarizes the trend analysis.Table 4-18Summary of Trend AnalysisIndicator/Measure % Change (2005-2009)Passenger trips (000) 17.61%Passenger miles (000) 28.55%Vehicle miles (000) 8.67%Revenue miles (000) 4.97%Total operating expense (000) 34.87%Passenger fare revenue (000) 39.37%Vehicles operated in maximum service 15.65%SERVICE SUPPLYVehicle miles per capita 13.14%SERVICE CONSUMPTIONPassenger trips per capita 22.47%Passenger trips per revenue mile 11.47%Passenger trips per revenue hour 9.45%QUALITY OF SERVICEAverage age of fleet -26.03%Number of system failures -35.68%Revenue miles between system failures 63.19%AVAILABILITYWeekday span of service 1.01%COST EFFICIENCYOperating expense per passenger trip 13.02%Operating expense per passenger mile 4.04%Operating expense per revenue mile 26.75%Maintenance expense per revenue mileNo ChangeOPERATING RATIOSFarebox recovery 4.37%FAREAverage fare 26.83%Tindale-Oliver & Associates, Inc.Pinellas Suncoast Transit AuthoritySeptember 2010 4-29 Transit Development Plan
PEER REVIEWA peer review analysis is generally conducted to compare a transit system’s performance at a given point intime with other transit systems having similar operating characteristics. A peer review was conducted usingvalidated 2008 NTD reports for PSTA and all potential peers. Selected performance indicators,effectiveness measures, and efficiency measures are provided throughout this section in tabular format toillustrate the performance of PSTA‘s fixed-route system relative to the peer group. For each selectedindicator and measure, the tables provide the PSTA value, the minimum value among the peer group, themaximum value among the peer group, the mean of the peer group, and the percent that the PSTA’svalues are away from the mean.The peer group selection was based foremost on geographic location within the southeastern U.S.; thestates included were Texas, Louisiana, Arkansas, Mississippi, Alabama, Tennessee, Kentucky, Virginia,North Carolina, South Carolina, Georgia and Florida. All the transit systems in these states were analyzedbased on seven indicators including four operating characteristics (passenger trips, revenue miles, vehiclesoperated in maximum service, and total operating expense) and three exogenous variables (service areasize, service area population, and service area population density).In order to select the systems most comparable with PSTA, each indicator’s value for PSTA was used as abase number. Based on this, 80 percent, 90 percent, 110 percent, and 120 percent of PSTA indicatorvalues were calculated, respectively. Potential peers were assigned a score for each of the indicatorsbased on the following criteria:Peers falling between 90 percent of the PSTA value and 110 percent of the PSTA value wereawarded 1.5 points;Peers falling between 80 percent and 90 percent of the PSTA value or between 110 percent and120 percent of the PSTA value were awarded 0.5 points;Peers falling below 80 percent or above 120 percent of the PSTA value were awarded 0.0 points.The total score for each of the indicators by corresponding peers were then summed based on the abovecriteria. The potential peers were then ranked in descending order and the top seven transit systems wereselected as final peers. The top seven peers obtained a total score of at least 2.0. Table 4-20 displays thefinal results of the peer selection process. In all, three Florida peers appear in the peer group, includingJacksonville Transportation Authority (JTA) (8 points), Hillsborough Area Regional Transit Authority (HART)(8 points), and Palm Beach County (PalmTran) (2 points). The remaining four peers are non-Florida transitsystems.Tindale-Oliver & Associates, Inc.Pinellas Suncoast Transit AuthoritySeptember 2010 4-30 Transit Development Plan
Transit SystemJacksonvilleTransportationAuthority (JTA)Hillsborough AreaRegional TransitAuthority (HART)Greater RichmondTransit Company(GRTC)Transit Authorityof River City(RCTA)Memphis AreaTransit Authority(MATA)Board of CountyCommissioners,Palm BeachCounty, PalmTran,Inc. (PalmTran)Birmingham-Jefferson CountyTransit Authority(BJCTA)PassengerTripsRevenueMilesTable 4-19Peer Selection ResultsServiceAreaSize(squaremiles)ServiceAreaPopulationServiceAreaPopulationDensityVehiclesOperatedinMaximumServiceTotalOperatingExpenseTotalScore0.5 1.5 1.5 1.5 1.5 1.5 0 8.01.5 0 1.5 1.5 0.5 1.5 1.5 8.01.5 0 1.5 0 0 0.5 0 3.50 0.5 0 0.5 0 0.5 1.5 3.00.5 0 0 1.5 0.5 0 0 2.50 0 0 0.5 0 0 1.5 2.00 0 0.5 0 1.5 0 0 2.0Three categories of indicators that were previously used to carry out the performance evaluation and trendanalysis were analyzed in the peer review process.Performance IndicatorsPerformance indicators include passenger trips, revenue miles, revenue hours, and operating expenses.Table 4-21 and Figures 4-5 through 4-8 show the peer review results for those performance indicators.MeasureTable 4-20Peer Review Analysis (Performance Indicators)PSTAPeer GroupMinimumPeer GroupMaximumPeer GroupMeanPSTA % FromMeanPassenger Trips (000) 12,522 3,084 15,081 10,958 14.28%Revenue Miles (000) 9,283 2,792 9,547 6,829 35.94%Revenue Hours (000) 647 224 647 496 30.44%Operating Expense (000) 50,354 19,386 66,047 45,347 11.04%Tindale-Oliver & Associates, Inc.Pinellas Suncoast Transit AuthoritySeptember 2010 4-31 Transit Development Plan
Figure 4-5 Figure 4-6Passenger TripsRevenue MilesBTCTABTCTAHARTHARTJTAPalmTr anMeanJTAPalmTr anMeanRCTARCTAMATAMATAGRTCGRTCPSTAPSTA0 2,000,000 4,000,000 6,000,000 8,000,000 10,000,000 12,000,000 14,000,000 16,000,0002,500,000 4,000,000 5,500,000 7,000,000 8,500,000 10,000,000Figure 4-7 Figure 4-8Revenue HoursOperating ExpenseBTCTABTCTAHARTHARTJTAPalmTr anMeanJTAPalmTr anMeanRCTARCTAMATAMATAGRTCGRTCPSTAPSTA200,000 300,000 400,000 500,000 600,000 700,00018,000,000 27,000,000 36,000,000 45,000,000 54,000,000 63,000,000 72,000,000The following is a summary of the peer review analysis performance indicators, based on the informationpresented in Table 4-21 and Figures through 4-5 to 4-8:Passenger trips for PSTA are approximately 14.3 percent above the peer group mean.Revenue miles for PSTA greatly exceed the peer group average by 35.9 percent.Revenue hours for PSTA are more than the peer group mean by 30.4 percent.PSTA’s operating expenses are higher than the peer group average by 11.0 percent.Effectiveness MeasuresEffectiveness measures include vehicle miles per captia, passenger trips per revenue mile, passenger tripsper revenue hour, and revenue miles between failures. Table 4-22 and Figures 4-9 through 4-12 presentthe results of peer review for these measures.Tindale-Oliver & Associates, Inc.Pinellas Suncoast Transit AuthoritySeptember 2010 4-32 Transit Development Plan
Table 4-21Peer Review Analysis (Effective Measures)Effective MeasuresPSTAPeer GroupMinimumPeer GroupMaximumPeer GroupMeanPSTA % FromMeanVehicle Miles Per Capita 12.32 4.56 12.32 9.77 26.07%Passenger Trips Per Revenue Mile 1.35 1.08 2.67 1.63 -17.37%Passenger Trips Per Revenue Hour 19 14 30 22 -11.58%Revenue Miles Between Failures 4,402 1,504 8,302 3,790 16.14%Figure 4-9 Figure 4-10Vehicle Miles Per CapitaPassenger Trips Per Revenue MileBTCTABTCTAHARTHARTJTAPalmTr anMeanJTAPalmTr anMeanRCTARCTAMATAMATAGRTCGRTCPSTAPSTA4.00 5.00 6.00 7.00 8.00 9.00 10.00 11.00 12.00 13.001.00 1.20 1.40 1.60 1.80 2.00 2.20 2.40 2.60 2.80Figure 4-11 Figure 4-12Passenger Trips Per Revenue HourRevenue Miles Between FailuresBTCTABTCTAHARTHARTJTAPalmTr anMeanJTAPalmTr anMeanRCTARCTAMATAMATAGRTCGRTCPSTAPSTA12 14 16 18 20 22 24 26 28 30 321,200 1,800 2,400 3,000 3,600 4,200 4,800 5,400 6,000 6,600 7,200 7,800 8,400Tindale-Oliver & Associates, Inc.Pinellas Suncoast Transit AuthoritySeptember 2010 4-33 Transit Development Plan
The results of Table 4-22 and Figures 4-9 through 4-12 are summarized below.Vehicle miles per capita for PSTA are atop the peer group, at 26.0 percent above the peer group mean.Passenger trips per revenue mile for PSTA are 17.4 percent below the peer group mean.Passenger trips per revenue hour for PSTA are 11.6 percent less than the peer group average.PSTA’s revenue miles between failures are 16.1 percent above the peer group average.Efficiency MeasuresEfficiency measures include operating expense per passenger trip, operating expense per revenue mile,operating expense per revenue hour, and farebox recovery. Table 4-23 and Figures 4-13 through 16highlight the peer review results of efficiency measures.Table 4-22Peer Review Analysis (Efficiency Measures)Efficiency MeasurePSTAPeer GroupMinimumPeer GroupMaximumPeer GroupMeanPSTA % FromMeanOperating Expense/Passenger Trip $4.02 $2.71 $6.42 $4.44 -9.43%Operating Expense/Revenue Mile $5.42 $5.42 $7.24 $6.71 -19.26%Operating Expense/Revenue Hour $77.85 $77.85 $114.29 $91.74 -15.14%Farebox Recovery 22.44% 12.75% 28.03% 19.04% 17.85%Figure 4-13 Figure 4-14Operating Expense Per Passenger TripOperating Expense per Revenue MileBTCTABTCTAHARTHARTJTAPalmTr anMeanJTAPalmTr anMeanRCTARCTAMATAMATAGRTCGRTCPSTAPSTA1.00 2.00 3.00 4.00 5.00 6.00 7.005.20 5.40 5.60 5.80 6.00 6.20 6.40 6.60 6.80 7.00 7.20 7.40Tindale-Oliver & Associates, Inc.Pinellas Suncoast Transit AuthoritySeptember 2010 4-34 Transit Development Plan
Figure 4-15 Figure 4-16Operating Expense Per Revenue Hours Farebox Recovery (%)BTCTABTCTAHARTHARTJTAPalmTr anMeanJTAPalmTr anMeanRCTARCTAMATAMATAGRTCGRTCPSTAPSTA76.00 80.00 84.00 88.00 92.00 96.00 100.00 104.00 108.00 112.00 116.0012.00 15.00 18.00 21.00 24.00 27.00 30.00The following is a summary of peer review results of efficiency measures presented in Table 4-19 andFigures through 4-23 to 4-16.Operating expense per passenger trip for PSTA is 9.4 percent below the peer group mean.Operating expense per revenue mile is below the peer group average by 19.3 percent.Operating expense per revenue hour is also below the peer group mean, at 15.1 percent below thepeer group average.PSTA achieves very good farebox recovery, at nearly 18 percent above the peer group mean.Summary Results of Peer Review AnalysisTable 4-24 provides a summary of the peer review analysis for PSTA. The table includes eachperformance measure, as well as the percent away from the peer group mean that PSTA stands. Thefollowing strengths and opportunities were identified for PSTA based on the peer review.Cost Efficiency - This is indicated as strength, since operating expense per passenger trip, operatingexpense per revenue hour and operating expense per revenue mile are below the mean for the peer group.Service Supply – PSTA vehicle miles per capita are well above the mean for the peer group.Operating Ratio – PSTA’s farebox recovery ratio of 22 percent is also well above the mean (19%) for thepeer group. PSTA effectively maintains farebox revenues that support the level of operating services beingprovided.Quality of Service - This area is also indicated as a strength. PSTA’s efforts in reducing the average age oftheir fleet is reflected in the number revenue miles between roadcalls and failures.Tindale-Oliver & Associates, Inc.Pinellas Suncoast Transit AuthoritySeptember 2010 4-35 Transit Development Plan
Service Effectiveness - Improving the effectiveness of its service is an area that provides PSTA anopportunity for improvement. PSTA’s performance in this category may be a reflection of the operatingenvironment in which the agency operates. Ongoing efforts within the county to encourage more transitsupportivedevelopment may help to boost the number of passenger trips per revenue mile and passengertrips per revenue hour.Table 4-23Peer Review Analysis SummaryPerformance Indicators/MeasuresPercent Away From MeanIndicatorsPassenger trips 14.28%Revenue miles 35.94%Revenue Hours 30.44%Operating expense 11.04%Service SupplyVehicle miles per capita 26.07%Service EffectivenessPassenger trips per revenue mile -17.37%Passenger trips per revenue hour -11.58%Quality of ServiceRevenue miles between failures 16.14%Cost EfficiencyOperating expense per passenger trip -9.43%Operating expense per revenue mile -19.26%Operating expense per revenue hour -15.14%Operating RatioFarebox recovery 17.85%Tindale-Oliver & Associates, Inc.Pinellas Suncoast Transit AuthoritySeptember 2010 4-36 Transit Development Plan
SECTION 5MARKET RESEARCH AND PUBLIC INVOLVEMENTThis section includes the documentation of public involvement and market research efforts conducted as partof this TDP update. PSTA public involvement efforts typically involve focus groups, user group/advisorycommittees, workshops, and market research. Information gathered assists in the evaluation of existingservice and proposed service modifications and improvements. In addition to these efforts, PSTA conductsan ongoing community outreach program which consists of a variety of public outreach activities. Asummary of those activities are also included in this section.As part of the TDP update, PSTA also began a market research study consisting of an on-board survey andinterviews with major employers in the county. To date, the on-board survey is complete and a summary ofthe results of that effort is included herein.ON-GOING COMMUNITY OUTREACH PROGRAMPSTA has an extremely effective community outreach and liaison program. On-going efforts performed aspart of that outreach program are summarized below.1. Regional Funding/Service Coordination: PSTA staff has coordinated with HillsboroughArea Regional Transit (HART) and Pasco County Public Transportation (PCPT) on regionaltransit funding and services. The three agencies effectively share FTA Section 5307 formulafunding and jointly developed a Regional Job Access and Reverse Commute Program.2. Trolley Leases: Working with the cities of St. Petersburg, Gulfport, and Clearwater, PSTAestablished vehicle lease agreements and operator training for community-based transitservices. Each community operates trolley vehicles in accordance with a service plan,which accompanies each respective lease agreement. The PSTA regular bus system andthe trolley services operated by local governments are closely coordinated to provide theopportunity for travel connections, without service duplication.3. WorkNet Pinellas: Marketing staff works with case managers to provide PSTA informationrelevant to jobseekers and employers. Participation in WorkNet job fairs is ongoing. TDPspecificactivities coordinated with WorkNet Pinellas included participation by WorkNet staffin a TDP Service Priorities Workshop and the opportunity to review the Draft TDP and FinalTDP. PSTA is continuing to coordinate with WorkNet staff in regard to improving theTindale-Oliver & Associates, Inc.September 20105-1Pinellas Suncoast Transit AuthorityTransit Development Plan
coordination of WorkNet needs and resources with PSTA services. Future efforts mayinclude a survey of WorkNet bus pass recipients.4. Purchased Service: The City of St. Pete Beach and Treasure Island do not currentlybelong to the Transit Authority. However, these communities jointly purchase PSTA transitservice that operates in their communities along the Gulf Boulevard corridor.5. Community Presentations and Local Public Involvement Programs: Marketing staffprovides special presentations to various groups in the community with respect to PSTAservice and programs. Life skills presentations for bus travel are provided, particularly forsupported employment and rehabilitation programs.6. Employer’s Choice Program: The PSTA Marketing Department staff vigorously promotesthis program whereby the employer can fully subsidize the cost of public transit commutebenefits and purchase 31-day Unlimited Ride Go Cards. With this benefit, employees get atax-free transit benefit and the employer receives a tax-reduction for the expense. Anotheroption is for the employee to pay the full cost for the purchase of transit passes with pre-taxsalary dollars. Finally, the employer and employees can share the cost of transit passes andshare the tax benefit.7. Development Coordination & Review: Staff works closely with local communities to reviewdevelopment and redevelopment plans and incorporate passenger amenities as part of theproject. This program is very successful with regard to the placement of passenger sheltersand benches throughout the community. Staff is also participating with local communities onredevelopment projects and providing input on conceptual design.8. Speakers Bureau “Show Me” Service: The PSTA Marketing Department has a veryambitious group of volunteers that offers presentations to community groups regarding therole of PSTA as a transportation provider, route and schedule information, and fare options.Also, "Show Me" service volunteers escort first-time riders on a complete round-trip thatincludes route schedules, fare information, and travel tips.9. Accessible Bus Stop Signage: In coordination with PSTA’s Transit Advisory Committee,new bus stop signs were developed to differentiate the bus stop from other “poles” alongroadways. These tactile signs include raised and Braille characters for 100 select PSTA busstops, which were identified with input from visually-impaired passengers.Tindale-Oliver & Associates, Inc.September 20105-2Pinellas Suncoast Transit AuthorityTransit Development Plan
10. Travel Training/Travel Aids Program: Travel training is offered by PSTA to persons withdisabilities so they can gain the skills and knowledge necessary for independent travel. Anindependent contractor of PSTA serves in the capacity as travel trainer and works withindividuals as they learn to navigate the regular bus system. New communication systemsare also available for low vision, blind, and deaf-blind passengers to assist with identifying busroutes. Using this Bus Identifier Kit, passengers can prepare a hand-held sign with thenumber of the bus route on which they want to travel. Use of this kit alerts the bus operatoras to the specific bus route the waiting passenger wishes to board. Development of thisprogram included assistance from local disability groups and organizations. Theseorganizations also refer passengers to PSTA for travel training.11. Social Service Agency Coordination: For many years, PSTA has leased surplusparatransit vehicles to area social service agencies to increase the accessibility of theTransportation Disadvantaged (TD) system. Monthly unlimited-ride bus passes are providedby PSTA free of charge to approximately 12 agencies for their travel trainers’ use during theprocess of travel training clients. Since 2007, PSTA leased surplus staff cars for use by jobcoaches for supported employment programs. Staff also works with local agencies on theprovision of passenger amenities including benches, shelters, curb cuts, and passengerloading pads for those bus stop locations serving agency clients.12. Inter-Agency Cooperation: PSTA is a very active partner in transit and transportation effortsin Pinellas County. Staff attends the monthly meeting of the Metropolitan PlanningOrganization (MPO) and the following MPO sub-committees:a. Bicycle Advisory Committee (BAC),b. Local Coordinating Board (LCB),c. Pedestrian Transportation Advisory Committee (PTAC), andd. Technical Coordinating Committee (TCC).13. Inter-County Transit Service: Regional connection points and transfer centers aremaintained by PSTA in Tarpon Springs, and Clearwater. These centers facilitate transitservice connections between PSTA, PCPT, and HART. Coordination efforts include theprovision of passenger benches and shelters, route and schedule information, shared busstop locations, and planning requirements. Passengers can also utilize a monthly bus passfor seamless travel between Pinellas and Hillsborough Counties. The “Passport” providesunlimited travel on PSTA and HART routes and inter-county connections via Routes 100X,200X, and 300X.Tindale-Oliver & Associates, Inc.September 20105-3Pinellas Suncoast Transit AuthorityTransit Development Plan
14. PSTA Web Page: In February 2001, PSTA launched its website, www.PSTA.net. The site iscontinually updated with minutes of the monthly Board meeting, special events, employmentopportunities, planning, and financial reports. Surveys also have been provided where thepublic can provide feedback on proposed service modifications and route performance. Tripplanning is also now available 24 hours a day, 7 days a week through the PSTA website or byusing Google Transit and PSTA has extended web access to its services via a number ofsocial networking websites including Facebook, Twitter, and LinkedIn. Over 7.2 millionpeople visited the PSTA web page.15. Board Workshops: The PSTA Board of Directors meets in workshop sessions monthly for indepthreview of specific topics. These workshops provide an opportunity for more informalreview and discussion on topics including, but not limited to the following: Investment Strategies Vision Plan Updates Strategic Planning Bus Wraps/Advertising Proposed Operating and Capital Budgets Market Research16. Service Requests and Programmed Service Improvements: The PSTA website is utilizedto receive requests for new and improved transit services from passengers. Each request isreviewed by staff and a written or verbal response is provided to the passenger. The websitealso includes programmed service improvements, including those in the adopted ten-yearTransit Development Plan.17. Public Input: Each PSTA Board meeting includes an open forum where comments areprovided with respect to discussion topics not on the Board Agenda. Before the Board voteson any action item, public input is also solicited.18. Schedule Outlets: The PSTA Marketing Department serves 193 locations by providing routeschedules and system maps through the mail, and another 90 locations are directly served byMarketing Staff. These locations include hotels, motels, restaurants, governmental offices,private corporations, and tourist attractions.19. Bus Information: Each bus has interior ad cards that address topics such as passengerseating and assistance, fares, Employer’s Choice, Emergency Ride Home Program, serviceTindale-Oliver & Associates, Inc.September 20105-4Pinellas Suncoast Transit AuthorityTransit Development Plan
improvements, and PSTA Board meetings. Passengers are afforded the opportunity to usevarious PSTA services and participate in commuter programs.20. Customer Service: The PSTA information line receives more than 1,200 calls per dayMonday through Saturday, and more than 500 calls on Sundays and Holidays. Customerservice personnel staff offices at Park Street Terminal, Grand Central Station, and WilliamsPark where bus passes are sold, route and schedule information is available, and assistanceis provided for passenger questions and concerns.21. Community Programs: Staff participates in education programs, including new riderassistance for supported employment and social service programs.22. Bus Operations: Each bus operator receives customer service training and uses a formknown as “From the Driver Seat.” This provides an opportunity to document passengers’complaints, concerns, or requests, as well as issues that arise during daily service provision(e.g., proposed passenger amenities, damaged bus stops, additional areas of concern, etc.).Supervisors review these forms with an opportunity for further review, investigation, andaction.23. University of Tampa Class Marketing Project: During the 2010 spring semester, PSTAworked with two University of Tampa undergraduate classes: a public relations class and anadvertising class. Each class had a team of four to six students that created a public relationsor advertising campaign for PSTA. PSTA staff provided data and support to each teamthroughout the semester. The students performed primary and secondary research for theirprojects. Staff also attended their final presentations to provide feedback and comment.Tindale-Oliver & Associates, Inc.September 20105-5Pinellas Suncoast Transit AuthorityTransit Development Plan
2010 PSTA MARKET RESEARCH STUDYIn spring 2010, PSTA began performing a transit market research study. Major tasks include assessing thetravel characteristics of bus riders and non-riders, obtaining rider’s opinion on potential serviceimprovements, and ascertaining the perceptions of transit of bus riders and major area employers.Feedback received from the market research study will assist PSTA in determining future transit needs inPinellas County.The market research study consists of two tools for gathering feedback from the community. The two toolsinclude an on-board survey and interviews with major area employers. Each market research tool isdescribed below.• On-board survey – The on-board survey is a tool used by transit agencies to gather feedback onvarious aspects of the transit agency’s operations and services directly from patrons. In addition, onboardsurveys assist agencies in determining the demographic make-up and travel characteristics oftheir existing patrons.• Employer interviews – Interviews with major employers in the area assist transit agencies intargeting and/or tailoring transit services that meet the needs of those employers. Understanding thetravel needs of the employees of large businesses also assists the transit agency in developingappropriate marketing and educational tools.The on-board survey was completed in April 2010. Employer interviews are scheduled to be performed inFall 2010. The following sub-section provides a summary of the on-board survey process and salientconclusions drawn from the analysis of the collected data.PSTA 2010 ON-BOARD SURVEYIn April 2010, PSTA undertook the conduct of an on-board survey of existing bus riders. The on-boardsurvey was utilized to collect rider input on current transit services and to provide direction for futureimprovements, marketing, and policies.Survey ApproachThe method for surveying bus riders was the distribution of a self-administered questionnaire to all personsboarding surveyed PSTA bus routes. Surveys were distributed on weekdays, Saturday, and Sunday. Thesurvey questionnaire utilized was similar in format and in the types of questions found in survey instrumentspreviously used by PSTA as part of other major on-board survey efforts. PSTA has been conducting majorTindale-Oliver & Associates, Inc.September 20105-6Pinellas Suncoast Transit AuthorityTransit Development Plan
on-board survey research in conjunction with major updates to its Transit Development Plan (TDP) since1995. The reason for keeping the survey similar to the previous versions was to allow for comparativeanalysis of current and historical data collected as part of each on-board survey.To collect a sample of completed surveys that was representative of PSTA ridership, a sampling plan wasdeveloped. Based on a 95 percent confidence level and a confidence interval of 10 percent, the minimumnumber of surveys needed to be collected for each route was determined. Overall, the sampling planindicated that 3,190 completed surveys needed to be collected. In order to reach that completed surveygoal, 11,990 surveys were packaged and made available for distribution.A total of 5,507 PSTA bus riders responded to the on-board survey. Exactly 1,000 (18%) surveys werecollected on Saturday and Sunday and 4,507 (82%) surveys were collected on weekdays.On-Board Survey Summary ResultsResults from the on-board survey provide insight into various aspects of PSTA service. Salient conclusionsdrawn from the on-board survey analysis are summarized in this section.Bus riders were generally more satisfied with PSTA service in 2010 than in 2007. The averageoverall satisfaction rating was 4.14 out of 5 in 2010, compared with 4.04 out of 5 in 2007.Respondents were least satisfied with the shade or shelter quality at bus stops and servicefrequency in both 2007 and 2010.PSTA continues to capture a large number of work trips. However, since 2004, the distribution oftrips among other trip purpose categories has increased.PSTA bus riders are generally regular users of the service. Seventy-two percent of respondentsindicate that they use PSTA bus service 5 days or more per week. A predominant number ofrespondents (approximately 90%) are “captive” riders who rely on PSTA as their primarytransportation option.Whereas older bus patrons prefer to use alternative fare payment options to cash, younger busriders tend to use cash.The two largest work start periods are between 6:00 a.m. and 10:00 a.m. and between 3:00 p.mand 6:00 p.m. In addition, a large proportion of bus riders indicate work end times that are laterthan 8:00 p.m.The percentage of bus patrons indicating that they access the PSTA website for information wasmuch higher in 2010 than in 2007. Website users were more satisfied with website userfriendliness in 2010 than in 2007. Website users also tend to be younger and/or more affluent.Respondents indicated later service on existing routes, more weekend service, and more sheltersas the three most important improvements needed.Tindale-Oliver & Associates, Inc.September 20105-7Pinellas Suncoast Transit AuthorityTransit Development Plan
The typical PSTA rider has a lower hourly wage and a lower household income in 2010 than in2007. Table 5-1 includes a comparison between the rider profiles developed from the 2007 and2010 on-board survey efforts. The proportion of respondents indicating a need to transfer to complete their trip dropped from 69percent in 2007 to 59 percent in 2010. The highest number of transit trips recorded based on the 2010 origin-destination analysisoccurred between the following areas of the county:o West St. Petersburg-Pinellas Park/Mid-Countyo East St. Petersburg-West St. Petersburgo East Clearwater-East St. Petersburgo Downtown Clearwater-ClearwaterThe results of that origin-destination analysis are shown in Map 5-1. Data shown in that map are based oninformation received for Questions 1 and 3 on the on-board survey.Table 5-1PSTA Ridership Profile (2007 and 2010)Category 2007 Average Rider Demographic 2010 Average Rider DemographicEthnic Origin White (Caucasian) – 57.5% White (Caucasian) – 54.9%Residency Classification Pinellas County Year Round Resident – 88.1% Pinellas County Year Round Resident – 92.0%Age 40.7 39.1Work Status Employed – 72.7% Employed – 66.0%Annual Household Income $20,995 $19,611Hourly Wage $12.00 $11.90Hours worked per week 38 37Tindale-Oliver & Associates, Inc.September 20105-8Pinellas Suncoast Transit AuthorityTransit Development Plan
Pasco CountyEAST LAKE RDGulfofMexicoALT US 19 | PINELLAS AVEALDERMAN RDTAMPA RDKEYSTONE RDTarpon SpringsPalm HarborEast LakePinellas CountyHillsborough CountyPinellas Suncoast Transit AuthorityTransit Development PlanFY 2011 - FY 2020CURLEW RDOldsmarDunedinSafety HarborClearwaterDowntown ClearwaterBelleairTampaBayTampaLargoFeather SoundNorth BeachesGandyPinellas ParkSeminoleNorth St. PetersburgWest St. PetersburgEast St. PetersburgSouth BeachesDowntown St. PetersburgSouth PasadenaGulfportSouth St. PetersburgMap 5-1:Highest Transit TripIntensity CorridorsTierra VerdeLEGENDPSTA Bus RoutesOrigin/DestinationTransit Trip IntensityHighest Trip IntensityHillsborough CountySource: PSTA 2010 On-board Survey2 1 0 2MilesManatee County
2010 MEDICAID BUS PASS USER SURVEYA telephone survey of Medicaid bus pass users was conducted in May 2010. PSTA offers free monthly buspasses to eligible Medicaid recipients. Medicaid recipients who are able to use the fixed-route service canuse these bus passes to complete their Medicaid trips. The phone survey served two major purposes, togather information on bus pass recipient use of the free bus passes and to ascertain general customersatisfaction levels from this user group.Survey ApproachThe method for surveying Medicaid bus pass users was to ask a given set of questions from a standardsurvey instrument by a trained surveyor via telephone. The sample of bus pass recipients was randomlyselected from a complete list of 5,623 PSTA Medicaid bus pass users. The telephone surveyor recordedthe answers to the corresponding questions on the survey instrument. The final results on the papersurvey instrument were then input into a database for analysis purposes. Table 5-2 presents the surveyresponse rate by question.Medicaid Bus Pass Survey ResultsA total of 56 completed surveys were collected for this telephone survey. The survey was divided intothree sections with a total of 13 questions. Survey results are documented in the following section and acomparison with the results of comparable questions from the 2010 on-board survey is provided whereapplicable.Section A: Questions about PSTA Fixed-Route Bus Service UseQuestion 1 asked respondents to provide the main reason they use PSTA fixed-route service.Respondents were allowed to select more than one response for this question. As shown in Figure 5-1,while the use of bus passes for doctor or medical appointments was indicated by 84 percent of theMedicaid bus pass recipients, shopping and work were referenced by 48 percent and 25 percent,respectively. This result shows that the Medicaid bus pass recipients do not always use the pass formedical trips, but tend to use the pass for other reasons, as well.Tindale-Oliver & Associates, Inc.September 20105-10Pinellas Suncoast Transit AuthorityTransit Development Plan
Figure 5-1Reason for Using Medicaid Bus PassDoctor or MedicalAppointment83.9%Social VisitSocial Service Agency1.8%1.8%Shopping48.2%School12.5%WorkOther25.0%19.6%0.0% 20.0% 40.0% 60.0% 80.0% 100.0%Question 2 asked respondents how they usually get to the bus stop. Figure 5-2 shows that thepredominant proportion of respondents, about 93 percent, indicated “Walk” as their primary access mode tothe bus stop. “Park-and-ride,” “Get a ride,” and “Other” categories were not mentioned as an access modeby any of the respondents.Tindale-Oliver & Associates, Inc.September 20105-11Pinellas Suncoast Transit AuthorityTransit Development Plan
Figure 5-2Bus Stop Access ModeBicycle, 1.8%Wheelchair/Scooter, 5.4%Walk, 92.9%Respondents were also asked how far they generally travel if they accessed the bus stop either by walkingor bicycling. Table 5-3 presents the average distance traveled by walkers and bicyclists.Table 5-3Average Distance Traveled to Access the Bus StopAccess Mode # of Respondents Average Distance TraveledWalk 38 2.3 (Blocks)Bicycle 1 6 (Blocks)Question 3 of the survey asked respondents how they would fulfill their transportation needs if the Medicaidbus pass program was not available. Figure 5-3 illustrates the results to this question. Approximately 34percent of respondents indicated they wouldn’t make the trip. Of the 13 respondents selecting the “Other”category, five indicated that they would pay for the bus to fulfill their transportation needs.Tindale-Oliver & Associates, Inc.September 20105-12Pinellas Suncoast Transit AuthorityTransit Development Plan
Figure 5-3How would you travel if you did not have a bus pass?Transportation …DART0.0%0.0%Taxi3.6%BicycleRide with someoneWalk12.5%12.5%14.3%Drive0.0%Wouldn't make trip33.9%Other23.2%0.0% 5.0% 10.0% 15.0% 20.0% 25.0% 30.0% 35.0% 40.0%Question 4 asked respondents how many days a week they use the Medicaid bus pass. Approximately 82percent of respondents use their Medicaid bus pass 4 days a week or more. Figure 5-4 illustrates theresults to this question.30.0%Figure 5-4How many days a week do you use your bus pass?25.0%25.5%23.6%20.0%18.2%15.0%12.7%14.5%10.0%5.0%0.0%0.0%5.5%1 2 3 4 5 6 7 or moreTindale-Oliver & Associates, Inc.September 20105-13Pinellas Suncoast Transit AuthorityTransit Development Plan
Question 5 was an open-ended question that asked respondents how the Medicaid bus pass program hasimproved their ability to travel throughout the county. For analysis purposes, answers to this question wereorganized into three categories. Those three categories include “Makes travel throughout the countypossible,” “Makes travel throughout the county easier,” and “Other.” The results to this question are shownin Figure 5-5.Figure 5-5Ability to Travel Throughout CountyOther29%Makes travelthroughout countypossible38%Makes travelthroughout countyeasier33%Section B: Customer ServiceQuestion 6 on the survey asked respondents to rate PSTA service. Respondents were given a list of eightservice-related criteria to rate as either “Very Poor,” “Poor,” “Fair,” “Good,” or “Very Good.” Therespondents could select their response by circling a number from 1 to 5, with 1 being “Very Unsatisfied”and 5 being “Very Satisfied.” The ratings of all the respondents were then averaged to obtain a final scorefor each criterion. The highest scores were given to bus safety, bus operator’s courtesy, and buscleanliness. Each of those categories received average rating scores above 4.0. The quality of shelter andshade at bus stops, transfer timing, temperature on the bus, and service frequency each received ratingsbelow 4.0. The final criterion, the rider’s overall satisfaction with PSTA service received an average scoreof 4.3. Figure 5-6 shows all eight categories and their respective average rating scores.Tindale-Oliver & Associates, Inc.September 20105-14Pinellas Suncoast Transit AuthorityTransit Development Plan
Figure 5-6PSTA Service Satisfaction RatingsBus safetyOverall satisfactionBus operator's courtesyBus Cleanliness4.34.34.24.1Frequency of busesTemperature on the bus3.63.6Transfer timing3.4Shade or shelter quality at bus stop3.00.0 0.5 1.0 1.5 2.0 2.5 3.0 3.5 4.0 4.5 5.0For Question 7, respondents were asked to select from a list of twelve potential improvements that theybelieve are the three most important improvements for PSTA to implement. In addition, a blank space wasprovided on the survey as a response category so that respondents could state their own improvement, ifneeded. Figure 5-7 displays the results to the service improvements questions for both the Medicaidsurvey and the on-board survey. More weekend service and more shelters are among the top threeimprovements for both surveys.Section C: About YouIn Question 8, respondents were asked to indicate the number of hours they usually work each week andtheir employment status. Figures 5-8 and 5-9 present the results to this question. In addition, acomparison with results from the on-board survey is also show in those figures.Tindale-Oliver & Associates, Inc.September 20105-15Pinellas Suncoast Transit AuthorityTransit Development Plan
Figure 5-7Preferred Service ImprovementsMore weekend serviceMore sheltersMore frequent service on existing routesLater service on existing routesMore benchesEarlier service on existing routesOtherMore service to new areasAbility to purchase bus passes at major transfer pointsImproved walking area around stopsMore bike racks at bus stopsExpress (limited stop) serviceBetter lighting at stops23.3%23.2%14.4%16.1%6.7%8.9%3.7%7.1%9.8%7.1%6.6%7.1%8.8%5.4%7.6%5.4%16.2%3.6%45.9%58.9%44.1%50.0%40.6%37.5%51.8%35.7%On-board SurveyMedicaid Survey0.0% 10.0% 20.0% 30.0% 40.0% 50.0% 60.0% 70.0%Figure 5-8Number of Working Hours per Week90.0%80.0%70.0%Medicaid SurveyOn-board Survey80.0%60.0%50.0%49.8%40.0%35.7%30.0%20.0%14.5%20.0%10.0%0.0%0.0%Over Full time (40+ Hrs) Full time (40 Hrs) Part Time (Less than 40 hrs)Tindale-Oliver & Associates, Inc.September 20105-16Pinellas Suncoast Transit AuthorityTransit Development Plan
Questions 9 through 13 asked respondents to indicate their age, gender, ethnic heritage, work status, andannual household income. These demographics allow for the construction of a profile of the averageMedicaid bus pass recipient. Table 5-4 presents that average profile. For comparative purposes, theaverage profile of a PSTA bus rider is also presented in that table. Figure 5-9 displays the responses to allof the demographic questions for both the on-board survey and the Medicaid bus pass survey.Table 5-4Average PSTA Bus Rider and Medicaid Bus Pass User ProfilesCategoryAverage Medicaid Bus Pass UserDemographicAverage PSTA Bus RiderDemographicGender Male MaleEthnic Origin Caucasian CaucasianAge 47.9 39.1Work Status Unemployed EmployedAnnual Household Income $8,673 $19,611Medicaid Bus Pass User Survey General ConclusionThe following section summarizes salient conclusions drawn from the results of the Medicaid bus passsurvey. Notable differences between similar questions on the on-board survey are also noted. Although doctor and medical appointments are the most frequently referenced trip purpose (84%), 48percent and 25 percent of respondents also indicated using PSTA service to complete shopping andwork trips, respectively.Results to Questions 3 and 5 of the Medicaid bus pass user survey reveal that Medicaid bus passusers rely heavily upon this program to fulfill their transportation needs.More weekend service and more shelters are among the top three preferred service improvementsfrom the Medicaid bus pass survey and the on-board survey.Overall, Medicaid bus pass recipients are more satisfied with PSTA service than general PSTA busriders.The typical Medicaid bus pass recipient and PSTA bus rider share a similar gender and ethnic makeup.However, the typical Medicaid bus pass user tends to be older and works fewer hours per week.Tindale-Oliver & Associates, Inc.September 20105-17Pinellas Suncoast Transit AuthorityTransit Development Plan
Figure 5-9Medicaid Bus Pass User and PSTA Bus Rider Demographics ComparisonHoushold Income Work Status Age Ethnic Heritage GenderMaleFemaleCaucasianAfrican-AmericanHispanicAsianOther17 or younger18 to 2425 to 3435 to 4445 to 5455 to 6465 to 74Over 74EmployedUnemployedUnder $10,000$10,000 to $19,999$20,000 to $29,999$30,000 to $39,99910.8%1.9%1.6%0.0%3.2%5.6%4.0%5.5%7.3%5.5%13.5%3.5%12.7%1.2%1.8%4.1%9.3%0.0%29.5%25.9%18.2%20.8%18.2%18.2%20.6%23.6%25.5%25.9%34.0%33.7%25.7%28.6%19.4%51.1%50.9%48.9%49.1%54.9%On-boardSurvey66.7%66.0%67.3%74.1%$40,000 to $49,9990.0%5.7%$50,000 or more0.0%6.2%0.0% 10.0% 20.0% 30.0% 40.0% 50.0% 60.0% 70.0% 80.0%Tindale-Oliver & Associates, Inc.September 20105-18Pinellas Suncoast Transit AuthorityTransit Development Plan
COMMITTEES AND WORKSHOPSA number of workshops were held with advisory committees and boards during the TDP developmentprocess. Below is a summary of major activities conducted with those groups.Transit Advisory Committee (TAC)The PSTA TAC is comprised of passengers and interested citizens that provide ongoing input to PSTA staffand the Board. The TAC meets monthly and provides input regarding service enhancement priorities andproposed service and fare modifications. Regular TAC bus ride reports provide information such aspassenger volumes, activity at terminal and transfer facilities, construction activity and resultingproblems/concerns, stop locations and spacing, bus operator commendations, and operational concerns.The membership assists with ride checks and passenger surveys that facilitate planning efforts.Similar to the previous TDP updates and progress report efforts, a workshop with PSTA’s Transit AdvisoryCommittee (TAC) was conducted to better delineate the focus of the needs assessment process. Membersof the committee were asked to participate in a discussion group process to help identify serviceimprovement priorities for PSTA over the next 10 years. This report reviews the methodology used toconduct the workshop. In addition, the overall results of the TAC’s input are summarized along with theprimary needs that ultimately will be used in developing PSTA’s 2011-2020 TDP.Service Enhancement Priorities WorkshopOn April 13, 2010, at a regularly-scheduled TAC meeting, a workshop was held with members of the TACand invited representatives from the Pinellas County MPO, Pinellas Planning Council (PPC), WorkNetPinellas, and FDOT to discuss PSTA transit enhancement priorities for the next 10 years. The TAC is amixed group of transit users and other interested citizens appointed by the PSTA Board of Directors toprovide input into the transit planning process and the day-to-day operation of the transit system. Transitusers are an important resource for transit agencies since they often can provide valuable insight into theservice and/or infrastructure improvements that can be made by the agencies to help increase ridershipand improve the overall transit experience. The workshop was conducted to provide a forum for the TACmembers and other key stakeholders to generate ideas and prioritize the most important neededimprovements for the PSTA system.The focus of the workshop was presented to the TAC as a simply-phrased question: “What PSTA serviceimprovements should be priorities over the next 10 years?” Next, five past priority lists developed with theassistance of previous TACs were reviewed to give current members a better understanding of the types ofimprovements that have been desired in the past and how priorities have shifted over time. Table 5-5presents these previous TAC workshop priority lists by period. The priorities from the 2008-2012 TDPTindale-Oliver & Associates, Inc.September 20105-19Pinellas Suncoast Transit AuthorityTransit Development Plan
update then were discussed in terms of PSTA’s progress to date in addressing the indicated needs. Forexample, with regard to the indicated need for more marketing to neighborhood associations and schools,PSTA has increased levels of neighborhood marketing and improved coordination with local schools.The workshop process then was discussed with the TAC. The basic process that was used to facilitate theworkshop is the Nominal Group Technique (NGT). The NGT process is designed to organize meetings in amanner that maximizes productivity. This process balances and increases participation. The NGT processis best suited for small group meetings designed for fact-finding, idea generation, or the search of problemsor solutions.Table 5-5Previous TAC Workshop Priorities2003-2004 More Frequent Service on Selected Routes Later Evening Service on Selected Routes More Equipment (Buses) Rules Enforcement for Passengers Expanded Express Bus Service2005-2009 Later Evening Service Customer Service Improvements Varied Marketing Techniques Improved Transfer Issues Increase/Improve Bus Stop Infrastructure2008-2012 More Weekend/Sunday Service More Marketing to Neighborhood Associations and Schools Implementation of HOV lanes Opportunities for Storage Space on Buses More Park-and-Ride Facilities2009-2018More Frequent ServiceExpanded Service Hours5-Minute Headways on Top 10 RoutesMore Express RoutesReallocate BRT Resources to Local ServiceThe NGT was developed to counter the problems often experienced in group meetings that prevent theinclusion of everyone’s ideas. This technique reduces the social and psychological dynamics of groupbehavior that are normally encountered. Examples of these sorts of problems include: a few individualsdominating the discussion, too many participants just listening, and few people taking the time to actuallyTindale-Oliver & Associates, Inc.September 20105-20Pinellas Suncoast Transit AuthorityTransit Development Plan
think about the issue at hand. People tend to be more creative when everyone is given a structuredopportunity to participate.Outline of NGT ProcessThe following outline lists each step of the NGT process, along with the benefits that each step contributesto the overall process.Silent Generation of Ideas in Writingo Allows time to think and provides a creative settingo Allows for improved focus and uninterrupted thoughto Avoids competition and status differenceso Avoids conformity pressureso Avoids polarization of ideasRecorded Round-Robin Listing of Ideas on Charto Structures participationo Depersonalizes ideaso Tolerates conflicting ideaso Provides written permanenceDiscussion of Each Idea on Charto Shows that each idea is as important as anothero Clarifies ideasVote on Prioritieso Provides focus on important issueso Avoids dominance by strong membersReview of Voteo Helps identify any voting inconsistencyo Allows group members to confirm voteTindale-Oliver & Associates, Inc.September 20105-21Pinellas Suncoast Transit AuthorityTransit Development Plan
Each of the steps in the NGT process is discussed in further detail below.Step 1: Silent Generation of Ideas in WritingAs indicated previously, the nominal question for the workshop was “What PSTA service improvementsshould be priorities over the next 10 years?” This question was presented to the group both in written form(on a worksheet that was handed out to all participants) and it was stated verbally. The participants thenwere given 5 minutes to respond to this question by writing brief phrases describing their five necessaryimprovements in the space provided on the worksheet.Step 2: Round-Robin Listing of Ideas on ChartThe next step of the process involved reading each TAC member’s ideas to the rest of the group. Eachidea provided was recorded by the facilitator on a flip chart. This procedure continued for all the responseworksheets until the responses to the nominal question were exhausted for all workshop participants. Thepages of the flip chart containing the provided ideas were displayed for further reference.Step 3: Discussion and Clarification of Each IdeaThe ideas listed on the flip chart then were discussed. The facilitator read each idea, indicated in generalterms the understood intent of the idea, and asked the group if there were any questions about it. Duringthis process, efforts were made to ensure that each idea was clarified appropriately and that it wasunderstood clearly by all participants. In addition, ideas similar in intent were grouped together to producea more concise listing of ideas. In some cases, additional probing was used to help identify more specificdetails about some of the ideas that were listed.Step 4: Vote on PrioritiesAt this point in the process, the participants again were reminded about the nominal question that they weretrying to address regarding priority PSTA service improvements needed in the next 10 years. Theparticipants then were instructed to select their preference for the five most important improvements fromthe entire list of ideas displayed on the flip chart pages and record these improvements on separateresponse sheets that the facilitator had provided. In addition to the participants selecting five importantimprovements, the facilitator asked each participant to rank in priority order the improvements listed on theircards from one (highest priority) to five (lowest priority). The participants were given approximately fiveminutes to complete this step, and they did so independently and without discussion. The following is asample of the response worksheet provided to participants for use in voting and prioritizing theimprovements.Tindale-Oliver & Associates, Inc.September 20105-22Pinellas Suncoast Transit AuthorityTransit Development Plan
Figure 5-10Sample Index Card Illustrating Rank-Order Voting ProcessStep 5: Review of the VoteDuring a break in the workshop, while other TAC business was being completed, the index cards werecollected and the priority voting was reviewed. A weighted score was assigned to each participant’sindicated improvement preferences in the following manner: the highest ranked improvement (i.e., ranked#1) would receive a score of five, the next highest would receive a score of four, and so on until the fifthrankedimprovement would receive a score of one. In cases where a participant ranked two or moreimprovements similarly, all of these improvements would be given an identical corresponding score. In thismanner, all of the participants’ listed improvements were scored and totals were tallied to identify the fivetop-ranked service improvements. The results of the vote then were recorded to provide a permanentrecord of the voting process and results. Lastly, the results were presented to the workshop participants fortheir consideration.Results of the MeetingTable 5-6 summarizes all of the service improvement ideas identified by TAC members during theworkshop, along with the results of the voting and prioritization process. The five top priorities are identifiedbelow:1. More Frequent Service (15 points)2. Improved Bus Comfort (12 points)3. More Weekend Service (10 points)4. More Aggressive and Targeted Marketing Countywide (9 points)5. Involvement and Coordination among Regional Stakeholders, Local Governments, and BusinessOwners (9 points)Tindale-Oliver & Associates, Inc.September 20105-23Pinellas Suncoast Transit AuthorityTransit Development Plan
Table 5-6TAC Workshop ResultsNominal Question:“What PSTA service improvements should be priorities over the next ten years?”Initial Number ofInitial Brainstorming IdeasVotesInvolvement and Coordination among Regional Stakeholders,Local Governments, and Business OwnersWeightedScoreFinalPrioritization5 9 4TInfrastructure and Amenity Improvements 1 4Real-Time Information 0 0More Direct Routing 0 0Accessible Path 1 5Additional Marketing and Construction of Park-and-Rides 1 3Aggressive and Targeted Marketing Countywide 3 9 4TMore Regional Service 1 3Implement BRT on Major Roads 0 0More Weekend Service 2 10 3More Night service 1 5Require Bus Stop Annunciation 0 0More Frequent Service 3 15 1Improved Bus Comfort 3 12 2Increased Route Coverage 0 0Provide Special Event Service 1 3Streamlined Fare Payment and Expedited Boarding 2 6Provide Feeder Routes for Park-and-Rides 1 1Travel Training and Mainstreaming 1 1Improved Rider Safety on Bus, at Stops, and Relating to BusStop Placement1 2Construct More Bus Bays 0 0Provide More Express Service Within County 0 0Implement Circulator Routes 0 0Tindale-Oliver & Associates, Inc.September 20105-24Pinellas Suncoast Transit AuthorityTransit Development Plan
Analysis of TAC PrioritiesPriority 1 – More Frequent ServiceThe results of the TAC workshop indicate that the participants believe that supplying more frequent serviceis the highest priority for PSTA. TAC members strongly believe that improving service frequency willincrease ridership by making the service more attractive to those who do not regularly use transit as theirprimary form of transportation.Priority 2 – Improved Bus ComfortThe second priority identified by TAC members is improved bus comfort. TAC members have repeatedlyexpressed concern over passenger etiquette, including patrons with excessive packages on the bus,passengers with large families, and patrons not offering their seat to the elderly when no other seats areavailable. TAC members noted that occasionally passengers are unable to board the bus if it is full forthese reasons. PSTA has already initiated a plan for an etiquette marketing campaign that should assist incombating some of these issues. TAC members commented that seats on the bus should be morecomfortable, and that buses are frequently too cold when the air conditioner runs. Safety on the bus is anadditional concern relating to bus comfort that should be addressed in the upcoming TDP.Priority 3 – More Weekend ServiceImplementation of more weekend service will assist PSTA users in daily travel needs, especially those whorequire public transportation on weekends to reach employment. The TAC emphasized the importance ofproviding additional weekend service for those without other transportation choices.Priority 4T – Aggressive and Targeted Marketing CountywideIncreasing ridership continues to be an important goal for PSTA. The TAC emphasized the need for anaggressive and targeted marketing campaign in order to assist with capturing new riders. TAC membersalso noted that many current paratransit users are capable of using fixed-route service and simply need tobe educated about how to the system.Priority 4T – Involvement and Coordination among Regional Stakeholders, Local Governments, andBusiness OwnersCoordination is essential for the implementation of all future PSTA improvements. TAC members noted theimportance of intergovernmental coordination in redevelopment projects and the need to gain thecooperation of business owners for installing bus-related amenities. The TAC also stressed adopting aregional approach to coordinating input from stakeholders about the future of transit in the Tampa Bayarea.Tindale-Oliver & Associates, Inc.September 20105-25Pinellas Suncoast Transit AuthorityTransit Development Plan
Participation from Local Agency RepresentativesIn addition to PSTA’s TAC members, selected representatives from the Pinellas County MPO, PPC,WorkNet Pinellas, and FDOT participated in the development of service improvement ideas for PSTA. Aninvitation was extended to these agencies to encourage participation in the development of PSTA’s 2011-2020 TDP. Each representative participated in the brainstorming process along with TAC members. Table5-7 shows the TDP priorities ranked by the local agency representatives:Table 5-7Local Agency Representative Workshop ResultsNominal Question:“What PSTA service improvements should be priorities over the next ten years?”Initial Brainstorming IdeasInvolvement and Coordination among Regional Stakeholders,Local Governments, and Business OwnersInitial Number ofVotesWeightedScoreFinalPrioritization7 22 1Infrastructure and Amenity Improvements 2 4 3TReal-Time Information 1 3More Direct Routing 1 4 3TAggressive and Targeted Marketing Countywide 1 4 3TMore Regional Service 1 1Implement BRT on Major Roads 1 3More Frequent Service 1 5 2Increased Route Coverage 1 3Streamlined Fare Payment and Expedited Boarding 1 3Travel Training and Mainstreaming 1 1Local agency representatives believe strongly in increasing involvement and coordination among a varietyof groups in order to enhance transit in Pinellas County. Additionally, stakeholders prioritized morefrequent service, infrastructure and amenity improvements, more direct routes, and aggressive andtargeted marketing as important transit enhancements for the future.Summary of WorkshopIn summary, a workshop was conducted to obtain consensus from TAC members regarding PSTA serviceimprovement priorities for the next 10 years. Numerous suggestions were made, all of which werediscussed and prioritized by the workshop participants. The final results reflect the most important serviceimprovements from the perspective of participants.Tindale-Oliver & Associates, Inc.September 20105-26Pinellas Suncoast Transit AuthorityTransit Development Plan
PSTA works closely with the TAC on a regular basis and the service improvement priorities identifiedthrough this workshop will be considered strongly as PSTA evaluates and prioritizes service improvementsfor the next 10 years.PINELLAS COUNTY TRANSPORTATION TASK FORCEThe Pinellas County Transportation Task Force (TTF) is composed of local business and communityleaders, and elected officials. The group is working to advance the work completed by the Transit FundingCommittee, and is currently scheduled to meet on a monthly basis. The major tasks of the group aresecuring a long-term, sustainable funding source for transit services in the county and building a coalition ofconsensus among community leaders in support of a possible sales tax referendum. To support thosemajor tasks, the TTF conducted an interactive public workshop on August 30, 2010 at the CollaborativeLabs facility at St. Petersburg College to gather feedback from Pinellas County residents on how best tospend revenue from any potential new funding sources.TRANSIT FUNDING COMMITTEEAssembled as an adjunct to the PSTA Board, the Pinellas County Transit Funding Committee wasdeveloped to assist PSTA with developing a strategy to secure stable and robust new funding source(s).Members of the committee include elected officials from both the PSTA Board and the MPO Board, as wellas key public- and private-sector stakeholders from around Pinellas County. The committee has beeninstructed to examine federal, state, and local funding options with the intent to propose feasible fundingopportunities for PSTA to pursue. Since September 2008, the committee held regular meetings to analyzeTindale-Oliver & Associates, Inc.September 20105-27Pinellas Suncoast Transit AuthorityTransit Development Plan
public transit funding issues. To date, several major findings and recommendations offered to the PSTABoard of Directors by the Transit Funding Committee include:Ad valorem tax revenues are not a long-term sustainable funding source. Based on marketresearch and feedback from citizens of Pinellas County, the most promising potential fundingsource would involve some level of sales tax, coupled with the elimination of PSTA’s current AdValorem tax.The committee fully supports the implementation of an alternatives analysis as a prerequisite tosecuring federal and local funds for the development and implementation of future public transitenhancements.The committee supports the formation of the Pinellas County Transportation Task Force topartner with local stakeholders in an effort to help publicize and shape plans for transit fundingand service improvements.PSTA VISIONNew vision and mission statements were developed in 2009. A visioning workshop was held on February9, 2009, that involved the PSTA Board, the Pinellas County MPO’s PMI Steering Committee, and otherinterested parties. The PSTA Board approved the new vision and mission statements at its December 2,2009 meeting. The approved vision and mission statements are as follows:VISION STATEMENT“Quick, affordable transportation from where you are to where you want to go.”MISSION STATEMENTPSTA provides safe, affordable public transit to our community. We help guide land use decisions andsupport economic vitality to enhance our quality of life.Tindale-Oliver & Associates, Inc.September 20105-28Pinellas Suncoast Transit AuthorityTransit Development Plan
SECTION 6SITUATION APPRAISAL AND NEEDS ASSESSMENTMany efforts are currently underway in the county that reveal a desire among county officials to implementmore transit-supportive land use and development patterns. The efforts have been embraced withoptimism and are expected to impact the demographic and economic makeup of the county.Consequently, those impacts will spur changes in the future transit market of Pinellas County and may offernew opportunities to improve service. As changes occur, an appraisal of the impacts of those changesneeds to be performed and appropriate changes to the structure of a transit service should be considered.In its effort to meet changing market needs, PSTA continues to tailor its services to provide the mosteffective service possible. This section of the TDP provides an evaluation of the impacts on PSTA servicefrom findings in the data, documents, and information presented in previous sections of this report. Inaddition, a progress report on milestones is presented to describe how PSTA is working to address marketimpacts identified in previous TDP efforts.PROGRESS REPORT ON MILESTONESA number of accomplishments were achieved by PSTA over the last year. The following sectionsummarizes major milestones achieved and provides a progress report on other activities PSTA is workingon in its efforts to meet changing market conditions.Transit InfrastructureHybrid Replacement VehiclesIn FY 2008, PSTA began a program of purchasing hybrid-electric vehicles. Hybrid-electric buses are moreexpensive than a typical bus, but they also consume less fuel, have a longer brake life, and reduceemissions. The hybrid vehicles have also been used to market PSTA as an environmentally-friendly transitagency. The most recent purchase of hybrid vehicles was completed using American Recovery andReinvestment Act (ARRA) funding. Fourteen new 35’ hybrid-electric vehicles were added to the PSTAfixed-route fleet in FY 2010.In addition to the ARRA funding being used to purchase the new hybrid vehicles, PSTA is applying forFederal Transit Administration (FTA) Section 5309 Discretionary Bus and Bus Facilities program funding topurchase an additional eight hybrid vehicles to replace eight 1999 model fleet vehicles that are scheduledfor replacement in 2011.“Mini-Hybrid” UnitsUtilizing FTA Transit Investment for Greenhouse Gas and Energy Reduction (TIGGER) Grant funding,PSTA is proposing to purchase 48 “mini-hybrid” units to be installed on 48 2006-model buses. The mini-Tindale-Oliver & Associates, IncPinellas Suncoast Transit AuthoritySeptember 2010 6-1 Transit Development Plan
hybrid units are designed to optimize vehicle operating temperatures, maintain longer maintenanceintervals, and reduce hydraulic oil, thereby improving passenger safety and reducing engine overheating.The use of mini-hybrid systems is gaining momentum in the transit industry as agencies anticipateachieving better mileage and generating lower emission levels using these types of units on older modelvehicles.New Passenger Shelter Design ConceptNew passenger shelter design concepts are currently being developed by PSTA. The new shelters willenhance and modernize PSTA’s image and will replace the existing shelter stock that currently are installedat bus stops throughout the county.Figure 6-1PSTA Conceptual Shelter DesignsADA Landing Pad InstallationPSTA is working on improving accessibility at bus stops. Using ARRA funding, PSTA is improvingpassenger boarding and alighting areas, performing curb retrofits, and enhancing the connectivity toadjacent sidewalks that provide a complete accessible route for bus service customer travel. Accessibilityimprovements are being made consistent with Americans with Disabilities Act Accessible Guidelines(ADAAG).To initiate the effort, PSTA conducted a detailed assessment of stops along several priority corridors.Based on that assessment, improvements were prioritized and PSTA is currently working to bring all stopsup to ADA standards. To support the construction of ADA-compliant bus stop areas, PSTA also developed10 landing pad designs to be used for the stop improvements. The landing pad designs are designed toaddress a host of stop details unique to each stop location. Over 200 stops have been completed as ofJune 2010.Tindale-Oliver & Associates, IncPinellas Suncoast Transit AuthoritySeptember 2010 6-2 Transit Development Plan
Regional Maintenance Training Facility DevelopmentPSTA has partnered with FDOT and the Center for UrbanTransportation Research (CUTR) to develop a certified transitmaintenance technician program. Development of the program wasspurred by an effort on the part of Florida transit agencies toimprove the quality of maintenance staff across the state. Just asautomobile mechanics can earn an Automotive Service Excellence(ASE) certification, students who complete the two-yearFDOT/CUTR course will earn an ASE Bus Master Techniciancertification.On-site training will occur at the PSTA Scherer Drive facility using amaintenance bay and a classroom reserved specifically for conductof the program. Use of the facility is open to community collegesand universities that offer post-secondary vocational programs and students participating in the programcan earn 33 credits toward their Associates Degree. Classroom materials and hands-on equipment suchas bus vehicle parts have been purchased through a funding agreement executed between PSTA andFDOT.Security Camera Installation ProjectSince 2002 PSTA has used an on-board security system on all PSTA buses and trolleys. The original onboardsecurity system employed outdated technology and was no longer supported by the vendor. Thenew on-board security system will use seven cameras instead of the six employed by the original securitysystem and will enhance PSTA’s ability to assist with accident investigation, claims support, employeetraining, and incident investigation.New Restroom Facility (34 th Street Lay-By)A new restroom facility was constructed at one of PSTA’s transfer facilities, the 34 th Street Lay-By. Locatedadjacent to PSTA’s main administration building, that transfer facility serves five PSTA fixed-bus routes,Routes 11, 52, 59, 97, and 98, and is also used as an operator relief point. Placement of the restroomfacility at this location improves PSTA customer service by enhancing the passenger amenities and otherinfrastructure found at this transfer point.AVL/Real-Time Bus Information Procurement (ARRA Funding)PSTA is in the process of installing a new Automatic Vehicle Location (AVL) system that will includeannunciators for all buses, real-time passenger information, and all other related support amenities.Passenger amenities will include predicted arrival times at terminals and transfer centers using informationmessage boards to be installed outside under canopies at each bus bay at PSTA bus terminals.Tindale-Oliver & Associates, IncPinellas Suncoast Transit AuthoritySeptember 2010 6-3 Transit Development Plan
Passengers will also be able to access predicted arrival times remotely using PDAs, cell phones, and otherelectronic devices.Intermodal FacilitiesThree major intermodal facilities are being planned for the county. The facilities will serve as major hubs oftransit activity and will be designed to offer transit users the ability to connect to various modes of publictransportation in the future.Downtown St. Petersburg – Several sites in and around Downtown St. Petersburg are beingconsidered that will provide enough space for vehicles to park and maneuver and that will minimizeschedule and routing changes to the existing service. This effort is being coordinated with the Cityof St. Petersburg. The City of St. Petersburg is currently conducting a study to improve bus,pedestrian, bicycle, and automobile circulation within the Downtown St. Petersburg core.Largo Towne Center – PSTA has been working with the City of Largo, property owners, anddevelopers of the Largo Towne Center on an appropriate transit center at the new commercialcenter. Conceptual design is complete and is proposed to include: sheltered waiting area, ticketbooth, bathroom facilities, lighting, security cameras, and enough space for five buses at any onetime.Downtown Clearwater – PSTA is also considering replacing of the Park Street Terminal located inDowntown Clearwater. The potential availability of shared-parking areas and other unbuilt propertynear the terminal has sparked efforts between PSTA and the City to further expand the transitfootprint in Downtown Clearwater. Discussions on intermodal connections and a possible BRTstation connecting proposed services to Clearwater Beach are currently underway.Tindale-Oliver & Associates, IncPinellas Suncoast Transit AuthoritySeptember 2010 6-4 Transit Development Plan
Other areas considered as viable locations for intermodal facility development include the City of Oldsmarand the Gateway/Carillon area. Currently, the City of Oldsmar is looking for opportunities to redevelop itsdowntown core. Proposed redevelopment plans being considered by the City will provide for transitsupportiveland uses. The Gateway/Carillon area serves as the entrance to Pinellas County for thosetravelling from Hillsborough County (Currently, two studies are underway that will examine the opportunityfor bringing rail service over the Howard Frankland Bridge and into Pinellas County). The Gateway/Carillonarea would be the ideal connection for such a service and consequently would require the development ofan intermodal facility to facilitate connections to other services operating in the county.Transit Planning and Land Use Planning StudiesPinellas County Alternatives Analysis and Howard Frankland Bridge StudyIn collaboration with FDOT, TBARTA, and the Pinellas County MPO, PSTA will be participating in twomajor transit studies that will impact the future of public transportation services in Pinellas County. TheHoward Frankland Bridge Study will be looking at premium transit service alternatives over the HowardFrankland Bridge, one of three bridges connecting Pinellas County and Hillsborough County over theTampa Bay. The Pinellas County AA will be assessing the feasibility of rail service in Pinellas County. Theprojects represent the first time all four agencies will work collaboratively on any one project.Tampa International Airport Express Bus Service StudyPSTA completed a study that examined the possibility of restructuring its two cross-bay express routes toprovide service to Tampa International Airport (TPA). PSTA does not currently serve TPA. In addition tothe review of demographic and socioeconomic data, the study included a survey of 1,169 airportemployees to gather data on residential zip codes, shift start and end times, work days, employers, modeof commute transportation, and willingness to use PSTA express bus service. In the future, PSTAproposes direct service to TPA and the study findings are necessary to finalize new routes serving TPA.Service Development FundingThe Service Development grant that was originally awarded to enhance bus services in the Central AvenueCorridor is now under consideration to implement enhanced bus service along 4th Street in St. Petersburgand connecting to employment in the Gateway/Carillon area, Downtown St. Petersburg and other activitycenters within that corridor. Such enhanced bus service may serve as a precursor to the proposed fixedguideway transit service to be evaluated through the Pinellas County Alternatives Analysis. The funding,in the amount of approximately $463,000 covers 50 percent of operating costs of the service and requiresa local match. The Service Development grant was initially designated to enhance bus services in theCentral Avenue Corridor however with the development of the MOU for the Pinellas County AlternativesAnalysis, the 4th Street Corridor is under consideration for future mass transit services and the increasedridership that would result from service enhancements will improve the possibility of obtaining federalTindale-Oliver & Associates, IncPinellas Suncoast Transit AuthoritySeptember 2010 6-5 Transit Development Plan
funding as part of the New Starts Program. As part of this Pilot Program, PSTA plans to “brand” theseenhanced services and dedicate a portion of its newly acquired hybrid bus fleet specifically to the 4th StreetCorridor.The premium services reflected in the Enhanced Bus Network Concept Plan will be considered for futureyear Service Development Program funding. These include enhanced services along the Central Avenueand Memorial Causeway corridors which have already been studied.Pinellas Planning Council (PPC) CoordinationPSTA is currently collaborating with the PPC in its effort to develop station area land developmentguidelines for adoption and implementation by local governments throughout Pinellas County. Using theservice corridors in the Pinellas Countywide Enhanced Bus Transit Network Concept, the PPC is identifyinglocations to focus transit-oriented development. The effort by PPC and PSTA builds on the relationshipbetween land use planning and transportation planning and is envisioned to link the land use planningefforts performed by the PPC with future transit improvements to be implemented by PSTA.The effort will also be used to support a grant submittal to the U.S. Department of Transportation (DOT)and the U.S. Housing and Urban Development (HUD). The two federal departments have initiated what isconsidered a groundbreaking collaborative effort designed to help foster planning for more livable,sustainable communities. The joint effort combines DOT TIGER II Planning Grants and HUD SustainableCommunity Challenge Grant Investments for localized planning activities that ultimately lead to projects thatintegrate transportation, housing, and economic development. Together, DOT and HUD will award up to$75 million for qualifying projects. Examples include the following:Planning activities related to the development of a particular transportation corridor or regionaltransportation system that promotes mixed-use or transit-oriented development with an affordablehousing component.Preparing or amending local codes and ordinances to encourage the private sector to developneighborhoods more sustainably and inclusively, with housing located near transportation andretail.FTA Section 5317 New Freedom FundingPSTA has secured funding under FTA’s Section 5317 New Freedom Program to hire a full-time MobilityManager. The new Mobility Manager will lead the coordination of the Transportation Disadvantaged (TD),Demand Response Transportation (DART), and Medicaid programs. Additionally, some of the funding fromthe grant will be used to develop a public information campaign and conduct travel training. The grant, inthe amount of $125,000, will be available in FY 2011.Tindale-Oliver & Associates, IncPinellas Suncoast Transit AuthoritySeptember 2010 6-6 Transit Development Plan
Transit Security GrantsPSTA has been awarded a Transit Security Grant under a Federal Security Grant Program. The grant willbe used to fund two projects: Protection of Key Operating Assets: Physical Hardening/Security of ControlCenter/Security of Stored Bus Yard/Maintenance/Transportation FacilitiesProtection of key operating assets will involve the hardening of entry gates and access points,establishing security perimeter fencing, new alarm communication with vehicle scanning, viewed/displayed/monitored/recording capacity CCTVs, and security perimeter lighting. The amount of thegrant to be expended on this effort is $1,118,112.Emergency Awareness and Response Strategy (EARS) Public Awareness and EducationprogramPSTA will develop a public awareness program that will incorporate the basics of the transit watchprogram and include additional information that is unique to the Tampa Bay Region. The programis called "Emergency Awareness and Response Strategy” (EARS) Public AwarenessCampaign. Through the implementation of this program, PSTA seeks to improve transit security,identify security-related barriers to transit and provide for enhanced coordination andcommunication with our safety and security partners within the community.Clearwater/Dunedin/Tarpon Springs Trolley PlanningPlanning work continues on a possible trolley routeconnecting Clearwater Beach, Dunedin, and possiblyTarpon Springs. The concept is to develop a serviceoperating on Fridays, Saturdays, and Sundays, whichbegins at approximately 10 a.m. in the morning andends at approximately 11:00 p.m. in the evening with60-minute service frequency. The trolley servicewould serve select destination points and provideconnectivity to other PSTA services including thecurrent PSTA Route 66. This route would help localbusinesses and enhance public transit options for bothresidents and visitors. To date, the discussion hadbeen focused on the Jolley Trolley providing this route as an extension to their current services. Thisservice is now being proposed for FDOT Service Development funding and PSTA is working with theTindale-Oliver & Associates, IncPinellas Suncoast Transit AuthoritySeptember 2010 6-7 Transit Development Plan
affected local communities in regard to the local match contribution needed for securing the ServiceDevelopment grant funds.Disability Ambassador Relations Transit Specialist (DARTS)To better meet the needs of the DART program, PSTA has committed staffing resources to serve as liaisonbetween the public, DART service users, PSTA staff, the TAC, and the PSTA Board. The specialist willassist DART applicants with travel training needs, application assistance needs, appeals process, and/orrecommendations for Personal Care Attendants (PCA). Additionally, the DARTS will serve as a conduit ofinformation to nursing homes, clinics, and other organizations that assist ADA-eligible persons. Suchinformation will include community outreach and presentations regarding DART eligibility certification and“Choice” services. Monthly reporting on outreach efforts and travel training will also be maintained by theDARTS. This specialist position enhances DART customer services with as needed, in-depth personalassistance and information.SITUATION APPRAISALThe requirements for a TDP major update include the need for a situation appraisal of the environment inwhich the transit agency operates. The purpose of this appraisal is to help develop an understanding of thePSTA transit operating environment in the context of the following elements: Regional transportation issues; Socioeconomic trends; Travel behavior; Land use; Public Involvement; and Technology.The assessment of these elements resulted in the identification of possible implications for PSTA. Theassessment and resulting implications are drawn from the following sources: Review of relevant plans, studies, and programs prepared at all levels of government (Section 2); Results of technical evaluation performed as part of the transit development planning process(throughout the TDP); Outcomes of discussions with PSTA staff and administration; and Input gathered through public involvement activities.Issues, trends, and implications are summarized for each of the major elements in the remainder of thissection.Tindale-Oliver & Associates, IncPinellas Suncoast Transit AuthoritySeptember 2010 6-8 Transit Development Plan
Regional Transportation IssuesOn May 22, 2009, TBARTA adopted “A Connected Region for Our Future: Tampa Bay Area RegionalTransportation Master Plan Vision.” The vision reflects a significant future investment in regional transitservices in Pinellas County, including bus rapid transit, express bus services, short-distance rail, andconnection to the Tampa-Orlando HSR. In addition, the TBARTA Master Plan reflects a substantial localsupporting bus network to feed the regional network and provide local bus circulation throughout PinellasCounty.FDOT, TBARTA, PSTA, and the Pinellas County MPO, are collaborating on two major transit planningendeavors to be performed in the Tampa Bay area that will impact the future of public transportationservices in Pinellas County. The Howard Frankland Bridge Study will be looking at premium transit servicealternatives over the Howard Frankland Bridge, one of three bridges connecting Pinellas and HillsboroughCounties over the Tampa Bay. The Pinellas County AA will be assessing the feasibility of rail service inPinellas County.Implications – As TBARTA moves forward with funding and implementation of the regional masterplan, it will be critical for PSTA to continue participating in regional transit planning efforts andproject implementation. The timeframe for implementation of regional transit services will be acritical consideration for PSTA in its decisions regarding future local bus service and itsconnectivity to the regional transit network. Additionally, the Howard Frankland Bridge Study andPinellas County AA provide an excellent opportunity to evaluate and implement feasible regionalconnections, including connection to HSR service in Downtown Tampa.Socioeconomic TrendsPinellas County’s population is projected to increase by 6 percent from 2010 to 2035 (938,556 to 998,301),according to forecasts derived from Traffic Analysis Zone (TAZ) data. Existing land use efforts to developtransit-oriented development (TOD) could impact this projection significantly. Seasonal populationestimates contribute an additional 8 percent to the permanent population figures. Additionally, a largeportion of bus passengers are elderly and/or physically impaired.Implications – PSTA must strive to meet transit demand as the population continues to grow inPinellas County. As population grows and ages, the role of transit will become an increasinglymore important component of transportation solutions in the county.Transit markets can be organized into three major categories: traditional markets, discretionary markets,and regional markets. The traditional market includes individuals who have no or limited transportationTindale-Oliver & Associates, IncPinellas Suncoast Transit AuthoritySeptember 2010 6-9 Transit Development Plan
alternatives and rely on public transit for essential and recreational trips. This market includes the elderly,youth, low-income, and no/limited vehicle populations. The discretionary market refers to individuals whohave a choice of transportation alternatives and may choose transit if the service is competitive with theautomobile in terms of travel time, convenience, and/or other factors. The regional market refers to thedemand for commuter travel to other counties in the region. This market was evaluated extensively as partof the TBARTA regional transit planning process.Implications – PSTA should continue to target traditional markets and continue efforts to gaindiscretionary riders. As economic development efforts in the county continue to mature, PSTAshould continue to modify its services in order to capture new riders and new transit markets.Travel BehaviorAs discussed in Section 2, local plans emphasize reducing travel by single-occupant vehicles throughincreasing multi-modal and intermodal transportation options, increasing intergovernmental coordination,and supporting PSTA in carrying out TDP proposals. According to the Pinellas County ComprehensivePlan, future roadway congestion projected to occur on major corridors requires evaluation of long-rangemobility options such as commuter rail and a guideway system.Some roadways in Pinellas County already possess a large proportion of transit trips. Locations with hightransit use should be targeted for premium service consideration. An analysis of transit trips in PinellasCounty revealed that the highest transit trip intensity occurs between the following locations:East and West St. PetersburgSt. Petersburg and Pinellas Park/Mid-CountySt. Petersburg and East ClearwaterSt. Petersburg and Largo/Mid-CountySt. Petersburg and South Pinellas County BeachesDowntown Clearwater and East ClearwaterImplications – PSTA will be continually challenged to provide service to those needing it but livingin areas that are not transit supportive. PSTA will have to become increasingly willing to considerinnovative public transit options. Corridors with a high transit trip intensity should receive prioritywhen considering premium service. Current corridors with lower trip intensity should be targetedfor other service enhancements or modifications.Tindale-Oliver & Associates, IncPinellas Suncoast Transit AuthoritySeptember 2010 6-10 Transit Development Plan
Land UseAlthough much of the current land use in Pinellas County is sprawling and not transit supportive, there area number of ongoing efforts throughout the county that are intended to change that land use pattern andthat will encourage transit-supportive development. The county, and various municipalities, are promotinginitiatives to concentrate development and intensify development in their respective communities that willcreate opportunities for PSTA to expand its service market. Such efforts are envisioned to replace thepredominance of low-density single-family development and highway commercial development in PinellasCounty which serves to encourage a dependency on personal automobile travel while hindering thedelivery of traditional fixed-route mass transit services in these areas. Many community leaders andorganizations are optimistic about the efforts to change existing land uses in Pinellas County in light of theeconomic development opportunities presented by transit-supportive development patterns.Implications – PSTA must continue to participate and coordinate with ongoing efforts thatencourage transit-supportive development throughout Pinellas County. PSTA should work toensure that land development policies and land development codes require transit infrastructure tosupport adequate levels of transit service.Two legislative initiatives, Senate Bill 360 (SB 360) and Amendment 4, may have implications forimplementation of PSTA services in the future. While SB 360 may enhance PSTA’s ability to implementservice, Amendment 4 will likely have a negative impact. State Growth Management Legislation (Senate Bill 360):Senate Bill 360 (SB 360) created a requirement that the State “evaluate and consider” a mobilityfee concept to replace the existing transportation concurrency system. Under SB 360, mobility feerevenue will provide for the flexibility to spend revenues on more than just roads. If a community’svision is to focus on multi-modal travel options, then the ability to spend “one-time payment”revenue on transit buses, infrastructure, or the construction of additional bicycle and pedestrianfacilities will help achieve that vision. PSTA stands to gain through implementation of a mobility feeby receiving a greater share of funding resulting from new development.A final summary judgment rendered August 26, 2010 by a circuit court in Tallahassee, Florida,declared SB 360 unconstitutional as a violation of the “unfunded mandates” provision, Article VII, §18(a) of the Florida Constitution. Consequently, the state legislature will be addressing the legalityof SB 360 in an upcoming legislative session.Tindale-Oliver & Associates, IncPinellas Suncoast Transit AuthoritySeptember 2010 6-11 Transit Development Plan
Amendment 4 (Florida Hometown Democracy):Amendment 4 would give Florida voters the right to decide whether their local comprehensive landuse plan should be changed. In effect, Amendment 4 would require referenda for everycomprehensive plan land use change. City councils and county commissions currently make landuse decisions. The measure will be placed on the statewide ballot on November 2, 2010. Themeasure may have an impact on transit-supportive land use amendments proposed in the PinellasCounty Future Land Use map, such as increases in residential or commercial densities, transitorienteddevelopment, and mixed-use zoning.Implications – PSTA must consider the implications of both SB 360 and Amendment 4 on futureservices. While SB 360 may provide additional funding for service enhancements, Amendment 4could negatively impact transit-supportive land use changes in Pinellas County.Public InvolvementPSTA has undertaken several activities to garner public input on future transit enhancements. On April 13,2010, a workshop was held with members of the TAC to discuss PSTA transit enhancement priorities forthe next 10 years. The workshop was conducted to provide a forum for the TAC members and other keystakeholders to generate ideas and prioritize the most important needed improvements for the PSTAsystem. Additionally, an on-board survey of PSTA fixed-route buses was conducted in April 2010 to collectrider input on current transit services and to provide direction for future improvements, marketing, andpolicies. Finally, a telephone survey was conducted in April 2010 on Medicaid bus pass users. The majorpurpose of this survey was to identify the main reasons for these Medicaid bus pass holders to use PSTAfixed-route service, their satisfaction levels with PSTA customer service, and opinions on possibleimprovements to the system.More frequent service and more weekend service were mentioned in the top five priorities of each publicinvolvement activity. Improving service frequency will increase ridership by making the service moreattractive to those who do not regularly use transit as their primary form of transportation. Implementationof more weekend service will assist PSTA users in daily travel needs, especially those who require publictransportation on weekends to reach employment. Additional weekend service is important for thosewithout other transportation choices.Additionally, both on-board survey respondents and Medicaid respondents mentioned later service andmore shelters as top priorities. Since 48 percent of on-board survey respondents and 25 percent ofMedicaid respondents use PSTA service for work trips, later service will further assist PSTA users inreaching destinations. Installing more shelters will make transit use more comfortable for riders, especiallyin the hot and rainy summer months.Tindale-Oliver & Associates, IncPinellas Suncoast Transit AuthoritySeptember 2010 6-12 Transit Development Plan
Implications – PSTA should prioritize the service improvements identified through publicinvolvement activities. Implementing more frequent service, more weekend service, later service,and more passenger shelters are PSTA priorities. However, service expansion will require a morestable and robust revenue source.TechnologyPSTA is making an effort to implement state-of-the-art technology and enhance the ability of customers toaccess transit information. PSTA is in the process of purchasing and installing a new Automated VehicleLocator (AVL) and real-time bus arrival systems. This upgraded technology allows customers to accesstransit information from hand-held devices and using dynamic message signs at key boarding locations.Additionally, PSTA has purchased a new camera system for the fleet in order to enhance safety forpassengers.In addition to implementing new technology,PSTA has made notable strides to “green”its transit fleet. In FY 2008, PSTA began aprogram of purchasing hybrid-electricvehicles. Compared with conventionalbuses, hybrid-electric buses consume lessfuel, have a longer brake life, and reduceemissions. The most recent purchase ofhybrid vehicles was completed using ARRAfunding. Fourteen new 35’ hybrid-electricvehicles were added to the PSTA fixedroutefleet in FY 2010. In addition to theARRA funding being used to purchase the new hybrid vehicles, PSTA will use FTA Section 5308 CleanFuels Grant funding and FTA Section 5308 Discretionary Bus and Bus Facilities program funding topurchase an additional eight hybrid vehicles to replace eight 1999 model fleet vehicles that are near theiruseful life.Finally, PSTA is proposing to purchase 48 “mini-hybrid” units to be installed on 48 conventional 2006-modelbuses with funds from the FTA TIGGER Grant Program. The mini-hybrid units are designed to optimizevehicle operating temperatures, maintain longer maintenance intervals, and reduce hydraulic oil, therebyimproving passenger safety and reducing engine overheating. The use of mini-hybrid systems is gainingmomentum in the transit industry as agencies strive for better mileage and generating lower emission levelsusing these types of units, particularly on older clean diesel vehicles.Tindale-Oliver & Associates, IncPinellas Suncoast Transit AuthoritySeptember 2010 6-13 Transit Development Plan
Implications – PSTA continues to emphasize technology implementation and “green” initiatives inorder to enhance customer service and encourage sustainability.RIDERSHIP FORECASTING USING THE TBEST MODELRidership forecasts were prepared using the FDOT-approved transit demand forecasting tool, TransitBoardings Estimation and Simulation Tool (TBEST). TBEST is a comprehensive transit analysis andridership-forecasting model that is capable of simulating travel demand at the individual route level. Thesoftware was designed to provide near- and mid-term forecasts of transit ridership consistent with theneeds of transit operational planning and TDP development. In producing model outputs, TBEST alsoconsiders the following:Transit network connectivity – Refers to the level of connectivity between routes within the busnetwork. The greater the connectivity between bus routes, the more efficient the bus servicebecomes.Spatial and temporal accessibility – Refers to service frequency and to distance between stops.The larger the physical distance between potential bus riders and bus stops the lower the level ofservice utilization. Similarly, less frequent service is perceived as less reliable and in turnutilization decreases.Time-of-day variations – TBEST accommodates peak period travel patterns by rewarding peakservice periods with greater service utilization forecasts.Route competition and route complementarities – TBEST accounts for competition between routes.Routes connecting to the same destinations or anchor points, or that travel on common corridors,experience decreases in service utilization. Conversely, routes that are synchronized and supporteach other in terms of service to major destinations or transfer locations and schedule benefit fromthat complementary relationship.PSTA chose to evaluate future ridership on all routes existing in FY 2009-2010. The following sectionoutlines the model input and assumptions used, includes a description of the TBEST scenario runperformed using the model, and summarizes the ridership forecasts produced by TBEST.Model Inputs/Assumptions and LimitationsTBEST uses various demographic and transit network data as model inputs. The inputs and theassumptions made in modeling the PSTA system in TBEST are presented below. It should be noted,however, that the model is not interactive with roadway network conditions. Therefore, ridership forecastswill not show direct sensitivity to changes in the roadway traffic conditions or speeds.Tindale-Oliver & Associates, IncPinellas Suncoast Transit AuthoritySeptember 2010 6-14 Transit Development Plan
Transit Network – The transit route network for all PSTA routes was updated to reflect 2009conditions, the validation year for the model. The transit network in TBEST required various edits toreflect the current route alignments and service characteristics in Pinellas County, including:o Generating bus stops by using a 1/8-mile interval between stops and 1/4-mile intervalbetween express bus stops, which do not necessarily correlate to current stops on theground;o Matching service span to existing service spans;o Modifying headways, also known as the frequency with which a bus will arrive at a stop(e.g. one bus every 60 minutes or one bus every 30 minutes);o Establishing passenger travel times on board a bus; ando Defining special generators.Demographic Data – The demographics used as the base input for the TBEST model are derivedfrom the 2000 Census and 2007 InfoUSA spatial and tabular databases. The model uses aCensus-Block-level personal geodatabase as the format for spatial distribution of populationdata. Varying data sets were used for TBEST because demographic data in TBEST is hardcodedand cannot be modified by end-users.Population and Employment Growth Rates – TBEST uses a socio-economic data growth functionto project population and employment data. A population growth rate and an employment growthrate were calculated using the 2035 TAZ forecasts developed for the Pinellas County LongRange Transportation Plan. System-wide annual growth rates for total population andemployment derived are 0.32 percent and 0.60 percent, respectively. As indicated previously,population and employment data are hard-coded into the model and cannot be modified by endusers.As applied, the growth rates do not reflect fluctuating economic conditions as experiencedin real time.TBEST Model Limitations – According to Rule 14-73.001 Florida Administrative Code, TBEST isthe FDOT-approved model for transit ridership forecasting as part of TDPs in Florida. It has longbeen a desire of FDOT to have a standard modeling tool for transit demand that could bestandardized across the State similar to the Florida Standard Urban Transportation ModelStructure (FSUTMS) model used by MPOs in developing LRTPs. However, while TBEST is animportant tool for evaluating improvements to existing and future transit services, model outputsdo not account for latent demand for transit that could yield significantly higher ridership, and,correspondingly, model outputs may over-estimate demand in isolated cases. In addition,TBEST cannot display sensitivities to external factors such as an improved marketing andadvertising program, changes in pricing service for customers, and other local conditions.Tindale-Oliver & Associates, IncPinellas Suncoast Transit AuthoritySeptember 2010 6-15 Transit Development Plan
Although TBEST provides ridership projections at the route and bus stop levels, its strength lies more in itsability to facilitate relative comparisons of ridership productivity. As a result, model outputs are not absoluteridership projections, but rather are comparative for evaluation in actual service implementation decisions.TBEST has generated interest with DOTs in other states and continues to be a work in progress that willbecome more useful as its capabilities are enhanced in future updates to the model. Consequently, it isimportant for the transit agency to integrate sound planning judgment and experience when interpretingTBEST results.Using these inputs, assumptions, and actual ridership data, the TBEST model was validated. Using thevalidation model as the base model, TBEST ridership forecasts for the TDP planning horizon year, FY2020, were developed. The generated annual ridership forecasts reflect the estimated level of serviceutilization if no changes were made to any of the fixed-route services.Transfer locations and special generators were determined in order to evaluate locations with opportunitiesfor high ridership. PSTA transfer locations include the following:Williams ParkGrand Central StationPark StreetPSTA 34 th Street FacilityIndian Rocks Shopping CenterGulf & 75 th AvenueShoppes at Park PlaceTyrone SquarePSTA special generators include the following:Gateway MallSeminole MallLargo MallUniversity of South Florida (USF) St. PetersburgEckerd CollegeClearwater MallCountryside MallTable 6-1 table shows the projected number of average daily riders by route in 2020 and ridership growthrates from 2009 to 2020 derived from TBEST. According to TBEST, weekday ridership is expected toTindale-Oliver & Associates, IncPinellas Suncoast Transit AuthoritySeptember 2010 6-16 Transit Development Plan
increase 5.33 percent (from 44,413 to 46,780 average daily riders) by 2020. Ridership on five routes(Route 7, 14, 60, 100X, and 300X) is forecast to grow by more than 8 percent. Of these routes, Route100X and 300X are estimated to increase in ridership by more than 10 percent, demonstrating that demandfor service between Hillsborough and Pinellas Counties will continue to increase. Map 6-1 shows thepercent change in ridership for all current routes in the PSTA system. Each of the identified routes withhigher projected growth serves the following special generators and transfer centers.Route 7: Williams Park, Grand Central, Tyrone Square MallRoute 14: Williams Park, Grand CentralRoute 60: Park Street, Clearwater MallRoute 100X: Gateway Mall, Marion Transit CenterRoute 300X: Ulmerton PNR, Marion Transit CenterImplicationsBased on the TBEST results shown, maintaining the status quo will result in only marginal increases inridership. In order for PSTA to attain its goal of doubling ridership, service expansion will need to occur.Service improvements identified through on-going and TDP-specific public involvement efforts and serviceimprovements identified in previously completed transit planning studies, such as the CountywideEnhanced Bus Transit Network Concept Plan and the Tampa International Airport Express Bus ServiceStudy, will need to be implemented to achieve that goal. In addition to the Pinellas County AA and HowardFrankland Bridge Study, those studies represent substantial planning and prioritization efforts performed byPSTA to analyze potential service improvements that will assist it in attaining its vision of doubling transitridership in Pinellas County.Tindale-Oliver & Associates, IncPinellas Suncoast Transit AuthoritySeptember 2010 6-17 Transit Development Plan
Table 6-1: Average Daily Ridership and Growth RatesPSTA TBEST Ridership and Growth Rates (2009-2020)RouteAverage Daily Average Daily Growth RateRidership (2009) Ridership (2020) (2009-2020)Route 1 211 224 6.01%Route 4 3,472 3,641 4.87%Route 5 832 860 3.43%Route 7 523 566 8.19%Route 11 858 893 4.02%Route 14 1,408 1,522 8.09%Route 15 530 555 4.72%Route 18 4,857 5,110 5.20%Route 19 5,394 5,708 5.81%Route 20 561 588 4.80%Route 23 824 856 3.78%Route 30 53 55 3.02%Route 32 224 239 6.33%Route 35 1,681 1,779 5.85%Route 38 509 530 4.11%Route 52 4,293 4,508 5.01%Route 58 428 453 5.79%Route 59 2,714 2,847 4.90%Route 60 1,798 1,973 9.78%Route 61 672 703 4.52%Route 62 625 651 4.05%Route 66 959 1001 4.32%Route 67 458 477 4.06%Route 68 264 271 2.65%Route 73 535 558 4.30%Route 74 2,081 2,177 4.62%Route 75 488 507 4.00%Route 76 458 484 5.52%Route 78 764 796 4.19%Route 79 2,125 2,219 4.42%Route 90 116 121 4.40%Route 93 113 117 3.64%Route 97 185 194 4.65%Route 98 96 102 6.26%Suncoast Beach Trolley 2,784 2,926 5.10%Route 100X 277 309 11.28%Route 300X 189 210 10.73%Route 444 52 54 4.05%Total Routes 44,413 46,780 5.33%Tindale-Oliver & Associates, IncPinellas Suncoast Transit AuthoritySeptember 2010 6-18 Transit Development Plan
EAST LAKE DRBELCHER RDUS 19ACR 39SR 58062ND ST N66TH ST N49TH ST NBELCHER RDPSTA 2020 Ridership ForecastPercent Change22ND AVE N9TH AVE N4TH AVE N5TH AVE NCENTRAL AVE1ST AVE S1ST AVE NLEGEND5TH AVE S28TH ST S11TH AVE S64TH ST S18TH AVE SPASADENA AVE S14TH AVE SPSTA FacilityTransit Hub26TH AVE S34TH ST S49TH ST S58TH ST SMajor Transfer CenterBLIND PASS RDRegional Mall54TH AVE SExisting Park-and-Ride Facility4TH ST S31ST ST SPINELLAS BAYWAY SGULF BLVDPASS A GRILLE WAYPINELLAS POINT DR SPSTA RoutesPercent Change (2009-2020)0.00 - 4.00%4.01 - 6.00%PINELLAS BAYWAY6.01 - 8.00%8.01 - 10.00%> 10.01%Hillsborough CoSource: PSTASUNSHINE SKYWAY2 1 0 2MilesI-275GANDY BLVDManatee Cou62ND AVE NEANCLOTE RDE LIVE OAK STKEYSTONE RDEAST LAKE RDGULF RD E TARPON AVEMERES BLVDE KLOSTERMAN RDBAY STLANSBROOK PKWYALDERMAN RDNEBRASKA AVECR 611CR 1CURLEW RDTAMPA RDSOLON AVEBAYSHORE BLVDSHORE DR EMAIN STPHILLIPPE PKWYUS HIGHWAY 19 NDREW STDRUID RDBELLEAIR RDSTARKEY RD113TH ST NSEMINOLE BLVD102ND AVE NPARK BLVD N4TH ST N62ND AVE N34TH ST N54TH AVE N46TH AVE N1ST ST N38TH AVE N30TH AVE N58TH ST NPARK ST N28TH ST NMCMULLEN BOOTH RDVIRGINIA STUNION STSUNSET POINT RDDOUGLAS AVESR 590N BETTY LNISLAND WAYCOURTNEY CAMPBELL CSWYCOURT STN FT HARRISON AVEMANDALAY AVEBAYSIDE BRIDGELAKEVIEW RDWYATT STROSERY RD NEEAST BAY DR8TH AVE SW150TH AVE NINDIAN ROCKS RD142ND AVE NULMERTON RDDRYER AVE 16TH AVE SEWILCOX RD126TH AVE NPinellas Suncoast Transit AuthorityTransit Development PlanFY 2011 - FY 2020I-275Map 6-1:OAKLEAF BLVDNORTHSIDE DRSR 580SR 5909TH AVE NROOSEVELT BLVDWALSINGHAM RD 118TH AVE N60TH ST NDR MARTIN LUTHER KING JR ST N86TH AVE NWHITNEY RDROOSEVELT BLVD82ND AVE N125TH ST N131ST ST N16TH ST NHAMLIN BLVD16TH ST N70TH AVE N71ST ST N19TH ST NDUHME RDTYRONE BLVD NGULF BLVD
SECTION 7TRANSIT DEVELOPMENT PLANProvided in this section are two financial plans: a revenue-constrained plan and a vision plan. Therevenue-constrained plan provides a financial plan under the assumption that current revenue sourcescontinue, but no additional revenue sources are secured. The vision plan assumes that a new revenuesource is secured and provides for future transit growth that meets the demand for transit service and thatwill support the economic development and transit-supportive land use planning efforts occurringthroughout the county. The two plans are presented to show how each scenario will impact PSTA service.REVENUE-CONSTRAINED PLANUnder the revenue-constrained plan, the revenue streams currently being used by PSTA would continue tobe utilized. The assumption is that no new revenue sources will be added to the budget under this plan.The plan assumes that the system will not experience growth due to the lack of new funds that couldsupport such growth. The 10-year operating budget and the 10-year capital budget for the revenueconstrainedplan are shown in Tables 7-1 and 7-2, respectively.Total operating expenses equal $613 million over the ten-year period while operating revenues total $553million for the same period. The total 10-year operating shortfall is approximately $60 million. As noted inTable 7-1, operating revenues are expected to begin to fall behind operating expenses in the first year ofthe plan, FY 2010/11. To address the shortfalls expected in the upcoming fiscal year, PSTA is proposing toimplement a number of service adjustments and a fare change in October 2010. A summary of thoseservice adjustments and the fare change is included in Appendix F. Revenues continue to fall behindexpenses each year through the 10-year planning horizon of the revenue-constrained plan.A large shortfall in the capital budget is shown in Table 7-2. Much of that shortfall can be attributed to thepurchase of rolling stock. Total capital expenses equal $156 million over the 10-year period while capitalrevenues total $116 million for the same period. The total 10-year capital shortfall is approximately $39million. The overall capital and operating shortfall for the 10-year period is $99 million. Figures 7-1 through7-3 illustrate the balance of expenditures and revenues for operating, capital, and operating and capitalcombined, respectively.To address the shortfalls in the revenue-constrained plan, PSTA has several options. The options wouldconsist of a mix of strategies including reducing service levels, increasing fares, and/or using funds fromthe reserve account. A strategy to use reserves to balance the budget could be implemented for a fewyears only to maintain as much service as possible until another funding source is secured. PSTA couldalso consider a moderate increase in the millage rate to balance the budget. The PSTA Board has theauthority to levy a millage rate of up to 0.75 mills.Tindale-Oliver & Associates, Inc.Pinellas Suncoast Transit AuthoritySeptember 2010 7-1 Transit Development Plan
Table 7-1Revenue-Constrained Plan – Operating BudgetFixed Route Bus 2011 2012 2013 2014 2015 2016 2017 2018 2019 2020 10-Year TotalOperating CostsExisting Service $54,501,742 $56,404,522 $58,506,278 $59,676,404 $60,869,932 $62,087,330 $63,329,077 $64,595,658 $65,887,572 $67,205,323 $613,063,837Total Costs $54,501,742 $56,404,522 $58,506,278 $59,676,404 $60,869,932 $62,087,330 $63,329,077 $64,595,658 $65,887,572 $67,205,323 $613,063,837Operating RevenuesExisting SourcesFare Revenue - Existing $11,555,944 $11,787,063 $12,022,805 $12,263,261 $12,508,526 $12,758,696 $13,013,870 $13,274,148 $13,539,631 $13,810,423 $126,534,367Auxiliary Revenue $184,800 $203,280 $223,608 $228,080 $232,642 $237,295 $242,040 $246,881 $251,819 $256,855 $2,307,301Non-Transportation Revenue $664,880 $624,203 $508,738 $518,913 $529,291 $539,877 $550,674 $561,688 $572,922 $584,380 $5,655,566Ad Valorem Tax $26,425,140 $25,103,883 $25,103,883 $25,605,961 $26,118,080 $26,640,441 $27,173,250 $27,716,715 $28,271,050 $28,836,471 $266,994,874Local Beach Trolley $600,000 $600,000 $600,000 $612,000 $624,240 $636,725 $649,459 $662,448 $675,697 $689,211 $6,349,781State Reimbursement - Fuel Tax $535,970 $535,970 $535,970 $546,689 $557,623 $568,776 $580,151 $591,754 $603,589 $615,661 $5,672,154State Grants $3,988,391 $4,068,159 $4,149,522 $4,232,512 $4,317,163 $4,403,506 $4,491,576 $4,581,408 $4,673,036 $4,766,496 $43,671,769Pass-Thru Grant $80,000 $80,000 $80,000 $81,600 $83,232 $84,897 $86,595 $88,326 $90,093 $91,895 $846,638Federal Grants $8,258,437 $8,671,359 $9,104,927 $9,287,026 $9,472,766 $9,662,221 $9,855,466 $10,052,575 $10,253,627 $10,458,699 $95,077,103Total Revenues $52,293,562 $51,673,917 $52,329,453 $53,376,042 $54,443,562 $55,532,434 $56,643,082 $57,775,944 $58,931,463 $60,110,092 $553,109,551Revenues Minus Costs ($2,208,180) ($4,730,605) ($6,176,825) ($6,300,362) ($6,426,369) ($6,554,897) ($6,685,995) ($6,819,714) ($6,956,109) ($7,095,231) ($59,954,286)Rollover from Prev. Year $0 ($2,208,180) ($6,938,784) ($13,115,610) ($19,415,972) ($25,842,341) ($32,397,238) ($39,083,232) ($45,902,946) ($52,859,055)Surplus/Shortfall ($2,208,180) ($6,938,784) ($13,115,610) ($19,415,972) ($25,842,341) ($32,397,238) ($39,083,232) ($45,902,946) ($52,859,055) ($59,954,286) ($59,954,286)Tindale-Oliver & Associates, Inc. Pinellas Suncoast Transit AuthoritySeptember 2010 7-2 Transit Development Plan
Table 7-2Revenue-Constrained Plan – Capital BudgetFixed Route Bus 2011 2012 2013 2014 2015 2016 2017 2018 2019 2020 10-Year TotalCapital CostsRevenue Vehicles $5,175,000 $2,678,063 $11,087,179 $7,172,019 $11,134,559 $0 $12,722,793 $39,504,271 $17,888,028 $23,803,854 $131,165,765Support Vehicles $207,000 $171,396 $266,092 $0 $0 $0 $152,674 $263,362 $218,064 $338,544 $1,617,131Other Capital $2,203,679 $2,205,231 $969,243 $960,205 $5,026,215 $4,248,376 $1,245,795 $1,045,584 $1,097,864 $4,352,757 $23,354,948Total $7,585,679 $5,054,690 $12,322,514 $8,132,224 $16,160,774 $4,248,376 $14,121,261 $40,813,217 $19,203,955 $28,495,154 $156,137,843Capital RevenuesExisting SourcesSection 5307 $9,288,466 $9,752,889 $10,240,533 $10,752,560 $11,290,188 $11,854,697 $12,447,432 $13,069,804 $13,723,294 $14,409,459 $116,829,323Total $9,288,466 $9,752,889 $10,240,533 $10,752,560 $11,290,188 $11,854,697 $12,447,432 $13,069,804 $13,723,294 $14,409,459 $116,829,323Revenues Minus Costs $1,702,786 $4,698,199 ($2,081,980) $2,620,336 ($4,870,586) $7,606,322 ($1,673,828) ($27,743,413) ($5,480,661) ($14,085,696) ($39,308,521)Rollover from Prev. Period $0 $1,702,786 $6,400,986 $4,319,005 $6,939,342 $2,068,756 $9,675,077 $8,001,249 ($19,742,164) ($25,222,825)Capital Surplus/Shortfall $1,702,786 $6,400,986 $4,319,005 $6,939,342 $2,068,756 $9,675,077 $8,001,249 ($19,742,164) ($25,222,825) ($39,308,521) ($39,308,521)Tindale-Oliver & Associates, Inc. Pinellas Suncoast Transit AuthoritySeptember 2010 7-3 Transit Development Plan
Figure 7-1Revenue-Constrained Plan – Operating Costs and Revenues$80,000,000$60,000,000$40,000,000OperatingCostsOperatingRevenues$20,000,000$02011 2012 2013 2014 2015 2016 2017 2018 2019 2020Figure 7-2Revenue-Constrained Plan – Capital Costs and Revenues$50,000,000$40,000,000$30,000,000$20,000,000CapitalCostsCapitalRevenues$10,000,000$02011 2012 2013 2014 2015 2016 2017 2018 2019 2020Tindale-Oliver & Associates, Inc.Pinellas Suncoast Transit AuthoritySeptember 2010 7-4 Transit Development Plan
$120,000,000Figure 7-3Revenue-Constrained Plan – Combined Operating and Capital Costs and Revenues$100,000,000$80,000,000CostsRevenues$60,000,000$40,000,000$20,000,000$02011 2012 2013 2014 2015 2016 2017 2018 2019 20202035 VISION PLANThe vision plan provides a service development plan in the event that an additional funding source issecured, such as a sales tax. If PSTA is able to secure a new funding source, then it can expand servicesbeyond those presented in the revenue-constrained plan. The vision plan takes into account the results ofthe situation appraisal, information gathered from public outreach efforts, and regional collaborative effortsoccurring throughout the Tampa Bay area. Implementation of the vision plan will also assist in shiftingPSTA’s role from provider of fixed-route bus service in the county to being the Mobility Manager for thecounty. Additionally, the vision plan acknowledges results from focus groups and a telephone surveyconducted by PSTA, which suggest that there is likely support in the county for a sales tax increase to fundpublic transit.The operating budget and capital budget for the first 10 years of the vision plan are shown in Tables 7-3and 7-4, respectively. Figures 7-4 through 7-6 illustrate the balance of expenditures and revenues foroperating, capital, and operating and capital combined, respectively. Service improvements, costassumptions for those service improvements, and revenue information are provided in this section.Tindale-Oliver & Associates, Inc.Pinellas Suncoast Transit AuthoritySeptember 2010 7-5 Transit Development Plan
Table 7-3Vision Plan – Operating Budget (FY 2010/11 – FY 2019/20)Fixed Route Bus 2011 2012 2013 2014 2015 2016 2017 2018 2019 2020 10-Year TotalOperating CostsExisting Service $50,243,237 $51,248,101 $37,526,361 $0 $0 $0 $0 $0 $0 $0 $139,017,698New Service $0 $0 $28,507,504 $85,957,417 $91,262,517 $96,745,439 $102,411,172 $108,264,836 $114,311,682 $116,597,916 $744,058,482Total Costs $50,243,237 $51,248,101 $66,033,865 $85,957,417 $91,262,517 $96,745,439 $102,411,172 $108,264,836 $114,311,682 $116,597,916 $883,076,180Operating RevenuesExisting SourcesFare Revenue - Existing $11,555,944 $11,787,063 $8,631,063 $0 $0 $0 $0 $0 $0 $0 $31,974,071Auxiliary Revenue $184,800 $203,280 $223,608 $228,080 $232,642 $237,295 $242,040 $246,881 $251,819 $256,855 $2,307,301Non-Transportation Revenue $664,880 $624,203 $508,738 $518,913 $529,291 $539,877 $550,674 $561,688 $572,922 $584,380 $5,655,566Property Tax $26,425,140 $0 $0 $0 $0 $0 $0 $0 $0 $0 $26,425,140State Reimbursement - Fuel Tax $535,970 $535,970 $535,970 $546,689 $557,623 $568,776 $580,151 $591,754 $603,589 $615,661 $5,672,154State Grants $3,988,391 $4,068,159 $4,149,522 $4,232,512 $4,317,163 $4,403,506 $4,491,576 $4,581,408 $4,673,036 $4,766,496 $43,671,769Pass-Thru Grant $80,000 $80,000 $80,000 $81,600 $83,232 $84,897 $86,595 $88,326 $90,093 $91,895 $846,638Section 5307 & Other Federal Grants $7,043,517 $7,407,335 $7,789,809 $8,179,299 $8,588,264 $9,017,677 $9,468,561 $9,941,989 $10,439,089 $10,961,043 $88,836,582New SourcesSales Tax for Bus $0 $31,957,626 $5,381,196 $38,676,849 $45,283,590 $66,311,240 $58,288,575 $8,499,697 $66,436,731 $24,638,741 $345,474,245Fare Revenue - New $0 $0 $6,556,726 $19,770,206 $20,990,379 $22,251,451 $23,554,569 $24,900,912 $26,291,687 $26,817,521 $171,133,451Bond Issues $0 $0 $99,000,000 $0 $0 $0 $0 $142,065,000 $0 $0 $241,065,000Debt Service $0 $0 -$6,470,679 -$6,470,679 -$6,470,679 -$6,470,679 -$6,470,679 -$15,756,104 -$15,756,104 -$15,756,104 -$79,621,707Total Revenues $50,478,642 $56,663,636 $126,385,952 $65,763,470 $74,111,505 $96,944,038 $90,792,063 $175,721,552 $93,602,861 $52,976,488 $883,440,208Revenues Minus Costs $235,406 $5,415,535 $60,352,088 ($20,193,947) ($17,151,012) $198,600 ($11,619,108) $67,456,716 ($20,708,821) ($63,621,427) $364,028Rollover from Prev. Year $0 $235,406 $5,650,940 $66,003,028 $45,809,081 $28,658,069 $28,856,669 $17,237,561 $84,694,276 $63,985,455 $364,028Surplus/Shortfall $235,406 $5,650,940 $66,003,028 $45,809,081 $28,658,069 $28,856,669 $17,237,561 $84,694,276 $63,985,455 $364,028 $364,028Tindale-Oliver & Associates, Inc. Pinellas Suncoast Transit AuthoritySeptember 2010 7-6 Transit Development Plan
Table 7-3 (Continued)Vision Plan – Operating Budget (FY 2010/11 – FY 2019/20)Light Rail 2011 2012 2013 2014 2015 2016 2017 2018 2019 2020 10-Year TotalOperating CostsTotal $0 $0 $0 $0 $0 $0 $0 $0 $0 $24,051,512 $24,051,512Operating RevenuesNew SourcesFare Revenue $0 $0 $0 $0 $0 $0 $0 $0 $0 $4,810,302 $4,810,302Sales Tax for Rail $0 $0 $0 $0 $0 $0 $0 $0 $0 $19,241,210 $19,241,210Total $0 $0 $0 $0 $0 $0 $0 $0 $0 $24,051,512 $24,051,512Revenues Minus Costs $0 $0 $0 $0 $0 $0 $0 $0 $0 $0 $0Surplus/Shortfall $0 $0 $0 $0 $0 $0 $0 $0 $0 $0 $0Tindale-Oliver & Associates, Inc. Pinellas Suncoast Transit AuthoritySeptember 2010 7-7 Transit Development Plan
Table 7-4Vision Plan – Capital Budget (FY 2010/11 – FY 2019/20)Fixed Route Bus 2011 2012 2013 2014 2015 2016 2017 2018 2019 2020 10-Year TotalCapital CostsExisting Service $7,585,679 $5,054,690 $12,322,514 $8,132,224 $16,160,774 $4,248,376 $14,121,261 $40,813,217 $19,203,955 $28,495,154 $156,137,843New Service $0 $41,740,282 $61,229,483 $34,725,811 $22,781,944 $16,451,130 $16,746,920 $42,053,062 $8,000,000 $8,000,000 $251,728,632Total $7,585,679 $46,794,972 $73,551,997 $42,858,034 $38,942,718 $20,699,506 $30,868,181 $82,866,279 $27,203,955 $36,495,154 $407,866,476Capital RevenuesExisting SourcesSection 5307 & Other Federal Grants $10,565,275 $11,111,002 $11,684,713 $12,268,949 $12,882,396 $13,526,516 $14,202,842 $14,912,984 $15,658,633 $16,441,565 $133,254,874New Sources $0Sales Tax for Bus $0 $32,704,374 $61,867,284 $30,589,085 $26,060,322 $7,172,990 $16,665,339 $67,953,296 $11,545,322 $20,053,590 $274,611,602Total $10,565,275 $43,815,376 $73,551,997 $42,858,034 $38,942,718 $20,699,506 $30,868,181 $82,866,280 $27,203,955 $36,495,155 $407,866,476Revenues Minus Costs $2,979,596 ($2,979,596) $0 $0 $0 $0 $0 $0 $0 $0 $0Rollover from Prev. Period $0 $2,979,596 $0 $0 $0 $0 $0 $0 $0 $0 $0Capital Surplus/Shortfall $2,979,596 $0 $0 $0 $0 $0 $0 $0 $0 $0 $0Light RailCapital CostsNew Service $0 $24,616,144 $25,796,915 $26,441,838 $27,102,884 $244,535,853 $250,649,250 $256,275,819 $262,682,715 $239,257,402 $1,357,358,820Total $0 $24,616,144 $25,796,915 $26,441,838 $27,102,884 $244,535,853 $250,649,250 $256,275,819 $262,682,715 $239,257,402 $1,357,358,820Capital RevenuesNew Sources $0Federal New Starts Funding $0 $12,308,072 $12,898,457 $13,220,919 $13,551,442 $122,267,927 $125,324,625 $128,137,910 $131,341,357 $119,628,701 $678,679,410Sales Tax for Rail $0 $64,662,000 $67,248,480 $69,938,419 $72,036,572 $74,197,669 $76,423,599 $77,952,071 $79,511,112 $96,709,488 $678,679,410Total $0 $76,970,072 $80,146,937 $83,159,338 $85,588,014 $196,465,596 $201,748,224 $206,089,981 $210,852,470 $216,338,189 $1,357,358,820Revenues Minus Costs $0 $52,353,928 $54,350,023 $56,717,500 $58,485,130 ($48,070,258) ($48,901,026) ($50,185,839) ($51,830,245) ($22,919,213) $0Rollover from Prev. Period $0 $0 $52,353,928 $106,703,951 $163,421,451 $221,906,581 $173,836,323 $124,935,297 $74,749,458 $22,919,213 $0Surplus/Shortfall $0 $52,353,928 $106,703,951 $163,421,451 $221,906,581 $173,836,323 $124,935,297 $74,749,458 $22,919,213 $0 $0Tindale-Oliver & Associates, Inc. Pinellas Suncoast Transit AuthoritySeptember 2010 7-8 Transit Development Plan
$200,000,000$180,000,000$160,000,000Figure 7-4Vision Plan – Operating Costs and Revenues (FY 2010/11 – FY 2019/20)$140,000,000$120,000,000$100,000,000$80,000,000$60,000,000$40,000,000$20,000,000$-2011 2012 2013 2014 2015 2016 2017 2018 2019 2020OperatingCostsOperatingRevenues$100,000,000Figure 7-5Vision Plan – Capital Costs and Revenues (FY 2010/11 – FY 2019/20)$80,000,000$60,000,000$40,000,000CapitalCostsCapitalRevenues$20,000,000$-2011 2012 2013 2014 2015 2016 2017 2018 2019 2020Tindale-Oliver & Associates, Inc.Pinellas Suncoast Transit AuthoritySeptember 2010 7-9 Transit Development Plan
Figure 7-6Vision Plan – Combined Operating and Capital Costs and Revenues (FY 2010/11 – FY 2019/20)$300,000,000$250,000,000$200,000,000$150,000,000$100,000,000TotalCostsTotalRevenues$50,000,000$-2011 2012 2013 2014 2015 2016 2017 2018 2019 2020Service ImprovementsThe vision plan consists of more than just bus service but fixed-guideway transit service, as well. Transitimprovements in the 2035 Vision Plan are comprised of four major networks of services. Those networksinclude the following:PSTA Alternatives Analysis (AA) CorridorsCross-Bay Express Bus ConnectorsPremium Bus NetworkLocal Service NetworkTogether, the four networks are designed to address regional and local public transportation needs. Adescription of each service network is provided below. In addition, Maps 7-1 through 7-3 illustrate the firstthree Vision Plan service networks and Map 7-4 illustrates all four service networks.Tindale-Oliver & Associates, Inc.Pinellas Suncoast Transit AuthoritySeptember 2010 7-10 Transit Development Plan
C.R. 77 (ROWAN)N.SUNCOASTTROUBLE CR RDSUNRAYC.R. 587 (GUNN)CYPRESS CREEK RUN15TH STUS 19ATURNER RD19TH STSR 580KEENE RDINTERSTATE 4 WS KEENE RDCROSSTOWN EXPY W49TH ST N66TH ST NBELCHER RDBIG BEND RDBEACH DR NE22ND AVE N13TH AVE N5TH AVE N1ST AVE STYRONE BLVD NI-3753RD ST NSt. Petersburg1ST AVE NI-175PASADENA AVE SN US HIGHWAY 41Map 7-1:22ND AVE S37TH ST S34TH ST SGULFPORT BLVD SBLIND PASS RD19TH AVE NEAlternatives AnalysisCorridors45TH AVE SFAIRWAY AVE S54TH AVE SPINELLAS BAYWAY SE COLLEGE AVEGULF BLVDINTERSTATE 75 NLegendS US HIGHWAY 41SUNSHINE SKYWAYHigh Speed RailINTERSTATE 75 SS US HIGHWAY 301SUNSHINE SKYWAYMajor Connection HubPINELLAS BAYWAYPinellas CountyAlternatives Analysis CorridorsANDERSON BLVDBradentonC.R. 587 (RIDGE)RIDGE RDI - 75C.R. 54TRINITY BLVDLUTZ LAKE FERN RDINTERSTATE 75 NN US HIGHWAY 41W LUTZ LAKE FERN RDTARPON SPRINGS RDKEYSTONE RDINTERSTATE 75 SEHRLICH RDE FLETCHER AVEVETERANS EXPY NINTERSTATE 275 SGUNN HWYW LINEBAUGH AVEVAN DYKE RDBRUCE B DOWNS BLVDSUNCOAST PKWY SPATTERSON RDEAST LAKE RDW BEARSS AVEHUTCHISON RDALDERMAN RDE BEARSS AVEW FLETCHER AVERACE TRACK RDN 56TH STW WATERS AVEE FOWLER AVEE BUSCH BLVDW BUSCH BLVDANDERSON RDSHELDON RDN FLORIDA AVEN NEBRASKA AVEN DALE MABRY HWYVETERANS EXPY SW HILLSBOROUGH AVEHARNEY RDE HILLSBOROUGH AVEORIENT RDCR 1INTERSTATE 4 EN 22ND STN 50TH STN ARMENIA AVEADAMO DRW KENNEDY BLVDINTERSTATE 275 NCAUSEWAY BLVDS 50TH STBAYSHORE BLVDCROSSTOWN EXPY ES DALE MABRY HWYS MACDILL AVES WEST SHORE BLVDN 40TH STMEMORIAL HWYW COURTNEY CAMPBELL CSWYS 78TH STS MANHATTAN AVEN 30TH STWILSKY BLVDBULLARD PKWYW SLIGH AVEE WATERS AVEW SLIGH AVEEISENHOWER BLVD NN LOIS AVEN ARMENIA AVECURLEW RDTAMPA RDBAYSHORE BLVDCAUSEWAY BLVDMAIN STS 20TH STN TAMPA STW PLATT STW AZEELE STN WEST SHORE BLVDUS HIGHWAY 19 NDREW STS LOIS AVEBELLEAIR RDI-275MADISON AVEULMERTON RDS US HIGHWAY 41W GANDY BLVD119TH ST NPINELLAS TRLGANDY BLVDSTARKEY RDRIDGE RD113TH ST NSEMINOLE BLVD102ND AVE NPARK BLVD N4TH ST N62ND AVE N54TH AVE N34TH ST N38TH AVE N16TH ST NPARK ST NMCMULLEN BOOTH RDSUNSET POINT RDSR 590N BELCHER RDN KEENE RDCOURT STBAYSIDE BRIDGEKEENE RDN PINELLAS AVESUNSET DRCR 611EDGEWATER DREAST BAY DRWEST BAY DRINDIAN ROCKS RD28TH ST NDR MARTIN LUTHER KING JR ST NS BELCHER RD71ST ST NCENTRAL AVEMOOGU.S. 41S.R. 54U.S. 19SR 580EVANS RD118TH AVE NDECUBELLISCONGRESSHALEPARKWAY BLVDSTARKEYPLATHEC.R. 1 (LITTLE RD)REPUBLIC DRBRYAN DAIRY RDOAKHURST RDKINGS HWYS BELCHER RD BELCHER RDN MYRTLE AVEGULF TO BAY BLVDS MISSOURI AVES FT HARRISON AVEI-275ROOSEVELT BLVDRIDGE RD SWMADISONC.R. 595 (GRAND BLVD)CECIELIATRINITY BLVDS.R. 56COLLIER PKWYGULF TRACEANCLOTE BLVDMAIN STLOUISIANABAILLEPERRINE RANCHBELL LAKE RDS.R. 54MITCHELL BLVDU.S. 41HILLS CO. RDWILLOW BEND PKWYBAILLIE'S BLUFF RDClearwater TampaLargo126TH AVE NWALSINGHAM RDCR 296PinellasParkGatewayPinellas Suncoast Transit AuthorityTransit Development PlanFY 2011 - FY 2020WestshoreHART AlternativesAnalysis Study AreaHillsborough County Corridors2 1 0 2MilesHighSpeedRailCOURTNEY CAMPBELL CSWYGANDY BRIDGEOVERLOOK DR NEBAY PINES BLVDDUHME RD150TH AVEGULF BLVD
C.R. 77 (ROWAN)N.SUNCOASTTROUBLE CR RDSUNRAYC.R. 587 (GUNN)CYPRESS CREEK RUN15TH STUS 19ATURNER RD19TH STSR 580KEENE RDINTERSTATE 4 WS KEENE RDCROSSTOWN EXPY W49TH ST N66TH ST NBELCHER RDBIG BEND RDBEACH DR NE22ND AVE N13TH AVE N5TH AVE N1ST AVE STYRONE BLVD NI-3753RD ST N1ST AVE NMap 7-2:St. PetersburgI-175PASADENA AVE SCrossbay Express BusConcept PlanN US HIGHWAY 4122ND AVE S37TH ST S34TH ST SGULFPORT BLVD SBLIND PASS RD19TH AVE NE45TH AVE SFAIRWAY AVE SSt. Pete Beach54TH AVE SPINELLAS BAYWAY SE COLLEGE AVEGULF BLVDINTERSTATE 75 NLegendS US HIGHWAY 41SUNSHINE SKYWAYHigh Speed RailINTERSTATE 75 SS US HIGHWAY 301Major Connection HubSUNSHINE SKYWAYPINELLAS BAYWAYCrossbay Express BusANDERSON BLVDGateway Mall Transfer CenterC.R. 587 (RIDGE)RIDGE RDI - 75C.R. 54TRINITY BLVDLUTZ LAKE FERN RDINTERSTATE 75 NN US HIGHWAY 41W LUTZ LAKE FERN RDTARPON SPRINGS RDKEYSTONE RDINTERSTATE 75 SEHRLICH RDE FLETCHER AVEVETERANS EXPY NINTERSTATE 275 SGUNN HWYW LINEBAUGH AVEVAN DYKE RDBRUCE B DOWNS BLVDSUNCOAST PKWY SPATTERSON RDEAST LAKE RDW BEARSS AVEHUTCHISON RDALDERMAN RDE BEARSS AVEW FLETCHER AVERACE TRACK RDN 56TH STW WATERS AVEE FOWLER AVEE BUSCH BLVDW BUSCH BLVDANDERSON RDSHELDON RDN FLORIDA AVEN NEBRASKA AVEN DALE MABRY HWYVETERANS EXPY SW HILLSBOROUGH AVEHARNEY RDE HILLSBOROUGH AVEORIENT RDCR 1INTERSTATE 4 EN 22ND STN 50TH STN ARMENIA AVEADAMO DRW KENNEDY BLVDINTERSTATE 275 NCAUSEWAY BLVDS 50TH STBAYSHORE BLVDCROSSTOWN EXPY ES DALE MABRY HWYS MACDILL AVES WEST SHORE BLVDN 40TH STMEMORIAL HWYW COURTNEY CAMPBELL CSWYS 78TH STS MANHATTAN AVEN 30TH STWILSKY BLVDBULLARD PKWYW SLIGH AVEE WATERS AVEW SLIGH AVEEISENHOWER BLVD NN LOIS AVEN ARMENIA AVECURLEW RDTAMPA RDBAYSHORE BLVDCAUSEWAY BLVDMAIN STS 20TH STN TAMPA STW PLATT STW AZEELE STN WEST SHORE BLVDUS HIGHWAY 19 NDREW STS LOIS AVEBELLEAIR RDI-275MADISON AVEULMERTON RDS US HIGHWAY 41W GANDY BLVD119TH ST NPINELLAS TRLGANDY BLVDSTARKEY RDRIDGE RD113TH ST NSEMINOLE BLVD102ND AVE NPARK BLVD N4TH ST N62ND AVE N54TH AVE N34TH ST N38TH AVE N16TH ST NPARK ST NMCMULLEN BOOTH RDSUNSET POINT RDSR 590N BELCHER RDN KEENE RDCOURT STBAYSIDE BRIDGEKEENE RDN PINELLAS AVECR 611EDGEWATER DREAST BAY DRWEST BAY DRINDIAN ROCKS RD28TH ST NDR MARTIN LUTHER KING JR ST NS BELCHER RD71ST ST NCENTRAL AVEMOOGU.S. 41S.R. 54U.S. 19SUNSET DREVANS RD118TH AVE NDECUBELLISCONGRESSHALEPARKWAY BLVDSTARKEYPLATHEC.R. 1 (LITTLE RD)SR 580REPUBLIC DRBRYAN DAIRY RDOAKHURST RDKINGS HWYS BELCHER RD BELCHER RDN MYRTLE AVEGULF TO BAY BLVDS MISSOURI AVES FT HARRISON AVEI-275ROOSEVELT BLVDRIDGE RD SWMADISONC.R. 595 (GRAND BLVD)CECIELIATRINITY BLVDS.R. 56COLLIER PKWYGULF TRACEANCLOTE BLVDMAIN STLOUISIANABAILLEPERRINE RANCHBELL LAKE RDS.R. 54MITCHELL BLVDU.S. 41HILLS CO. RDWILLOW BEND PKWYBAILLIE'S BLUFF RDCOURTNEY CAMPBELL CSWYClearwater Tampa126TH AVE NWALSINGHAM RDGatewayPinellas Suncoast Transit AuthorityTransit Development PlanFY 2011 - FY 2020HighSpeedRailWestshoreBradenton2 1 0 2MilesHOWARD FRANKLANDGANDY BRIDGECR 296OVERLOOK DR NEBAY PINES BLVDDUHME RD150TH AVEGULF BLVD
C.R. 77 (ROWAN)N.SUNCOASTTROUBLE CR RDSUNRAYC.R. 587 (GUNN)CYPRESS CREEK RUN15TH STTURNER RD19TH STINTERSTATE 4 WS KEENE RDCROSSTOWN EXPY W66TH ST NBELCHER RD49TH ST NBIG BEND RD22ND AVE N13TH AVE NCentral AveMadeiraBeachI-375Downtown St. Petesburg5TH AVE N1ST AVE SCENTRAL AVEN US HIGHWAY 4122ND AVE S37TH ST S34TH ST SGULFPORT BLVD STreasureIslandBLIND PASS RD19TH AVE NESt. PetersburgMap 7-3:PSTAPremium Bus NetworkConcept Plan45TH AVE SFAIRWAY AVE S54TH AVE SPINELLAS BAYWAY SE COLLEGE AVESt. Pete BeachINTERSTATE 75 NS US HIGHWAY 41SUNSHINE SKYWAYINTERSTATE 75 SLegendS US HIGHWAY 301SUNSHINE SKYWAYPINELLAS BAYWAYANDERSON BLVDHALEPARKWAY BLVDI - 75BELL LAKE RDC.R. 54U.S. 41S.R. 56S.R. 54COLLIER PKWYU.S. 41INTERSTATE 75 NN US HIGHWAY 41W LUTZ LAKE FERN RDINTERSTATE 75 SEHRLICH RDE FLETCHER AVEINTERSTATE 275 SGUNN HWYW LINEBAUGH AVEVAN DYKE RDBRUCE B DOWNS BLVDSUNCOAST PKWY SW BEARSS AVEHUTCHISON RDE BEARSS AVEW FLETCHER AVEN 56TH STW WATERS AVEE WATERS AVEE FOWLER AVEE BUSCH BLVDW BUSCH BLVDANDERSON RDHARNEY RDN FLORIDA AVEE HILLSBOROUGH AVEN NEBRASKA AVEN DALE MABRY HWYVETERANS EXPY SORIENT RDINTERSTATE 4 EN 22ND STN 50TH STN ARMENIA AVEADAMO DRW KENNEDY BLVDCAUSEWAY BLVDS 50TH STBAYSHORE BLVDCROSSTOWN EXPY ES DALE MABRY HWYS MACDILL AVES WEST SHORE BLVDN 40TH STS 78TH STS MANHATTAN AVEN 30TH STBULLARD PKWYW SLIGH AVEHILLS CO. RDWILLOW BEND PKWYW SLIGH AVEEISENHOWER BLVD NN LOIS AVEN ARMENIA AVES 20TH STN TAMPA STW PLATT STW AZEELE STN WEST SHORE BLVDS LOIS AVEMADISON AVES US HIGHWAY 41INTERSTATE 275 NW GANDY BLVDLUTZ LAKE FERN RDGANDY BRIDGEVETERANS EXPY NWILSKY BLVDSHELDON RDMEMORIAL HWYI-275C.R. 587 (RIDGE)RIDGE RDDECUBELLISCONGRESSMAIN STSTARKEYLOUISIANAPLATHEMADISONC.R. 595 (GRAND BLVD)CECIELIABAILLEC.R. 1 (LITTLE RD)TRINITY BLVDN PINELLAS AVESUNSET DRS.R. 54MOOGGULF TRACEPERRINE RANCHTRINITY BLVDU.S. 19ANCLOTE BLVDMITCHELL BLVDBAILLIE'S BLUFF RDTARPON SPRINGS RDKEYSTONE RDS PINELLAS AVEPATTERSON RDEAST LAKE RDALDERMAN RDRACE TRACK RDCR 611CR 1US 19ACURLEW RDTAMPA RDBAYSHORE BLVDCAUSEWAY BLVDSR 580REPUBLIC DRSR 580W HILLSBOROUGH AVEMAIN STW COURTNEY CAMPBELL CSWYDREW STUS HIGHWAY 19 NBELLEAIR RDGULF BLVDULMERTON RD119TH ST NPINELLAS TRLGANDY BLVDSTARKEY RDRIDGE RD102ND AVE N113TH ST N4TH ST NPARK BLVD NSEMINOLE BLVD62ND AVE N54TH AVE N34TH ST N38TH AVE N16TH ST NPARK ST NMCMULLEN BOOTH RDSUNSET POINT RDEDGEWATER DRSR 590N BELCHER RDN KEENE RDBAYSIDE BRIDGEKEENE RDEAST BAY DRWEST BAY DRINDIAN ROCKS RD118TH AVE NBRYAN DAIRY RD28TH ST NOAKHURST RDKINGS HWYCOURTNEY CAMPBELL CSWYS BELCHER RD BELCHER RDHOWARD FRANKLANDI-275ROOSEVELT BLVDDR MARTIN LUTHER KING JR ST NS BELCHER RD126TH AVE NWALSINGHAM RDCR 29671ST ST NOVERLOOK DR NEBAY PINES BLVDDUHME RD150TH AVECollegeNew Port RicheyTarpon SpringsClearwaterBeachIndianRocksRedingtonShoresPalm HarborDunedinDowntownClearwaterTyroneSquareRegional Activity CenterDowntownLargoLargoMallCountrysidePinellasParkShoppes atPark PlaceOldsmarClearwater MallSt. Pete/Clearwater AirportGatewayCommercial Activity CenterCommunity/CityPremium Bus Service2 1 0 2MilesPinellas Suncoast Transit AuthorityTransit Development PlanFY 2011 - FY 2020
C.R. 77 (ROWAN)N.SUNCOASTTROUBLE CR RDSUNRAYC.R. 587 (GUNN)CYPRESS CREEK RUN15TH STTURNER RD19TH STINTERSTATE 4 WS KEENE RDCROSSTOWN EXPY W66TH ST NBELCHER RD49TH ST NHigh Speed RailBIG BEND RD22ND AVE N13TH AVE NCentral AveCrossbay Express BusMadeiraBeachI-375Downtown St. Petesburg5TH AVE N1ST AVE SCENTRAL AVEPinellas CountyAlternatives Analysis CorridorsN US HIGHWAY 4122ND AVE S37TH ST S34TH ST SGULFPORT BLVD STreasureIslandBLIND PASS RD19TH AVE NESt. Petersburg45TH AVE SFAIRWAY AVE SPremium Bus Service54TH AVE SPINELLAS BAYWAY SE COLLEGE AVESt. Pete BeachINTERSTATE 75 NLoca BusService NetworkS US HIGHWAY 41SUNSHINE SKYWAYINTERSTATE 75 SS US HIGHWAY 301SUNSHINE SKYWAYPINELLAS BAYWAYANDERSON BLVDHALEPARKWAY BLVDI - 75BELL LAKE RDC.R. 54U.S. 41S.R. 56S.R. 54COLLIER PKWYU.S. 41INTERSTATE 75 NN US HIGHWAY 41W LUTZ LAKE FERN RDINTERSTATE 75 SEHRLICH RDE FLETCHER AVEINTERSTATE 275 SGUNN HWYW LINEBAUGH AVEVAN DYKE RDBRUCE B DOWNS BLVDSUNCOAST PKWY SW BEARSS AVEHUTCHISON RDE BEARSS AVEW FLETCHER AVEN 56TH STW WATERS AVEE FOWLER AVEE BUSCH BLVDW BUSCH BLVDANDERSON RDHARNEY RDN FLORIDA AVEE HILLSBOROUGH AVEN NEBRASKA AVEN DALE MABRY HWYVETERANS EXPY SORIENT RDINTERSTATE 4 EN 22ND STN 50TH STN ARMENIA AVEADAMO DRW KENNEDY BLVDCAUSEWAY BLVDS 50TH STBAYSHORE BLVDCROSSTOWN EXPY ES DALE MABRY HWYS MACDILL AVES WEST SHORE BLVDN 40TH STS 78TH STS MANHATTAN AVEN 30TH STBULLARD PKWYW SLIGH AVEE WATERS AVEHILLS CO. RDWILLOW BEND PKWYW SLIGH AVEEISENHOWER BLVD NN LOIS AVEN ARMENIA AVES 20TH STN TAMPA STW PLATT STW AZEELE STN WEST SHORE BLVDS LOIS AVEMADISON AVES US HIGHWAY 41INTERSTATE 275 NW GANDY BLVDLUTZ LAKE FERN RDGANDY BRIDGEVETERANS EXPY NWILSKY BLVDSHELDON RDMEMORIAL HWYI-275C.R. 587 (RIDGE)RIDGE RDDECUBELLISCONGRESSMAIN STSTARKEYLOUISIANAPLATHEMADISONC.R. 595 (GRAND BLVD)CECIELIABAILLEC.R. 1 (LITTLE RD)TRINITY BLVDN PINELLAS AVESUNSET DRS.R. 54MOOGGULF TRACEPERRINE RANCHTRINITY BLVDU.S. 19ANCLOTE BLVDMITCHELL BLVDBAILLIE'S BLUFF RDTARPON SPRINGS RDKEYSTONE RDS PINELLAS AVEPATTERSON RDEAST LAKE RDALDERMAN RDRACE TRACK RDCR 611CR 1US 19ACURLEW RDTAMPA RDBAYSHORE BLVDCAUSEWAY BLVDSR 580REPUBLIC DRSR 580W HILLSBOROUGH AVEMAIN STW COURTNEY CAMPBELL CSWYDREW STUS HIGHWAY 19 NBELLEAIR RDGULF BLVDULMERTON RD119TH ST NPINELLAS TRLGANDY BLVDSTARKEY RDRIDGE RD102ND AVE N113TH ST N4TH ST NPARK BLVD NSEMINOLE BLVD62ND AVE N54TH AVE N34TH ST N38TH AVE N16TH ST NPARK ST NMCMULLEN BOOTH RDSUNSET POINT RDEDGEWATER DRSR 590N BELCHER RDN KEENE RDBAYSIDE BRIDGEKEENE RDEAST BAY DRWEST BAY DRINDIAN ROCKS RD118TH AVE NBRYAN DAIRY RD28TH ST NOAKHURST RDKINGS HWYCOURTNEY CAMPBELL CSWYS BELCHER RD BELCHER RDHOWARD FRANKLANDI-275ROOSEVELT BLVDDR MARTIN LUTHER KING JR ST NS BELCHER RD126TH AVE NWALSINGHAM RDCR 29671ST ST NOVERLOOK DR NEBAY PINES BLVDDUHME RD150TH AVECollegeNew Port RicheyTarpon SpringsClearwaterBeachIndianRocksRedingtonShoresPalm HarborDunedinDowntownClearwaterDowntownLargoLargoMallCountrysidePinellasParkTyroneSquare2 1 0 2Shoppes atPark PlaceOldsmarClearwater MallSt. Pete/Clearwater AirportGatewayPinellas Suncoast Transit AuthorityTransit Development PlanFY 2011 - FY 2020Westshore TampaMap 7-4:PSTA 2035Transit VisionMilesHART AlternativesAnalysis Study AreaHighSpeedRailLegendGateway MallTransfer CenterMajor Activity CenterRegional Activity CenterCommercial Activity CenterCommunity/City
PSTA Alternatives Analysis CorridorsThe AA corridors reflect the study area for the Pinellas County AA. The study area connects the Gatewayarea, Downtown St. Petersburg, Downtown Clearwater, and Hillsborough County via I-275. The AAcorridors will represent a major mass transit corridor in the county that could include the implementation ofrail service with a connection to HSR service in Downtown Tampa.Cross-Bay Express Bus ConnectorsThis network of express bus services will provide inter-county connectivity and will support regional travelpatterns between Hillsborough and Pinellas County. Two service routes will provide a direct connectionbetween the HSR service and Pinellas County beaches. One service route will operate betweenDowntown St. Petersburg and Tampa International Airport, and the last route will mimic the existing PSTARoute 100X service, which currently provides commuter express service between Gateway and the MarionTransit Center in Downtown Tampa.Premium Bus NetworkThe premium bus network is based on the MPO’s Countywide Enhanced Bus Transit Concept Plan (2008).That plan was prepared to delineate a conceptual premium bus network that consists of a dynamic set oftransportation modes operating in concert to improve mobility and accessibility to major activity centersthroughout the county. The premium bus network will consist of bus rapid transit, limited-stop, and expressbus services.Local Service NetworkPSTA has developed a concept for a network of local bus service that will support the MPO’s CountywideEnhanced Bus Transit Concept Plan. A set of guiding principles was developed for this analysis, along withcatchment areas for feeder routes and community circulators. This network of service routes will lay thefoundation for the future local bus and circulation system implementation, which will support the premiumbus network.Financial PlanThe following financial plan is predicated on Pinellas County seeking a sales tax increase to fund transitinfrastructure and operations. The sales tax would be used in part to fund bus improvements and in part tofund fixed-guideway transit improvements. For the purposes of developing costs for the financial plan,fixed-guideway service improvements are assumed to consist of light rail service. Due to the long-terminvestment required by light rail transit service and the desire to provide better information to be used inother county, regional, and state plans, the vision plan contained herein stretches well beyond the 10-yearTDP timeframe and, in fact, covers a 25-year planning horizon.Tindale-Oliver & Associates, Inc.Pinellas Suncoast Transit AuthoritySeptember 2010 7-15 Transit Development Plan
Fixed-Guideway Transit (Rail)As indicated, fixed-guideway transit improvements are assumed to be light rail; however, mode choicewould be determined through the AA process. A double-track rail line of approximately 26 miles isassumed to connect St. Petersburg and Clearwater and would accommodate future connectivity across theHoward Frankland Bridge to connect to the light rail system proposed for Hillsborough County and the newHSR service connecting Tampa to Orlando. However, operating costs for rail service to HillsboroughCounty are not included in this plan.It is assumed that the 26 miles of track would be built in two phases and that it will take at least three and ahalf years to complete the AA, initiate and complete project design, and receive approval for funding fromFTA for each of the two phases. This would allow construction of the first phase to begin in FY 2015/16. Itis assumed that construction of the first phase will take approximately four years. The first 13-mile segmentwould be in operation in FY 2019/20 and the total corridor would be in operation by FY 2023/24.The light rail service would operate 18 hours per day, from 6:00 AM to 12:00 AM, with a service frequencyof 15 minutes during the week, on Saturdays, and on Sundays. Based on research of other light railsystems, operating costs per revenue hour are assumed to be $310 in 2010 dollars. A total of 3,700annual deadhead hours have been estimated for inclusion in the operating cost assumptions.Light rail capital cost assumptions include the following. Based on research of other light rail systems, capital costs for the light rail line are assumed to be $71million per mile for double tracks in 2010 dollars, including start-up costs. The capital inflation factor for rail is 2.5 percent. Light rail vehicle costs are $4,250,000 each. Each train is assumed to operate with two train cars. Fourteen trains, consisting of two train cars each, would operate during peak service periods. The spare ratio for light rail vehicles is 20 percent.Station costs are $1,000,000 and consist of a basic set of passenger amenities, i.e., benches, shelters,lighting, trash receptacles, bicycle racks, windscreen, ticket vending machines, and signage.A command center, maintenance yard facility, and yard are programmed at an estimated total cost of$21 million. A light maintenance yard is programmed to be located near the end of the rail line tosupport the second phase of rail service development.Addition of $77.5 million in transfer facility improvements between FY 2013/14 and FY 2022/23. Thattotal includes development of 10 major transfer facilities and 4 intermodal facilities. Intermodal facilitylocations include Downtown Clearwater, Downtown St. Petersburg, Oldsmar, and Gateway and willinclude park-and-ride facilities of at least 250 parking spaces each.Five satellite park-and-ride facilities are programmed at a cost of $525,000 each. Satellite park-andridefacilities consist of an average of 60 parking spaces each.Tindale-Oliver & Associates, Inc.Pinellas Suncoast Transit AuthoritySeptember 2010 7-16 Transit Development Plan
Fixed-Route BusFixed-route bus service improvements are programmed to occur in two waves. The first wave of busimprovements will occur in FY 2012/13 and FY 2013/14 and will consist of an additional 273,000 annualrevenue hours of service for premium and expanded local bus service. Premium bus service will enhancePSTA’s 10 most productive local bus routes and other bus service improvements will improve peakfrequencies on local feeder routes connecting with the premium bus network to 10- to 15-minutefrequencies. An additional 66,000 annual revenue hours of service will be added for expanded cross-bayexpress bus services and the Memorial Causeway BRT. A total of 134 additional vehicles will be requiredto support this service expansion, 115 vehicles for premium and local bus service expansion and 19 for thecross-bay and BRT service.A second wave of bus improvements will be implemented beginning in FY 2013/14 and will include addingapproximately 246,000 revenue hours of service to the system. Those revenue hours of service will beused to improve service hours and frequencies throughout the system and will require the addition of 66hybrid vehicles to the fleet.Total revenue service hours are estimated to be 1,207,451 in 2035. Operating costs per revenue hour areassumed to be $79.22 in 2010 dollars and the operating cost inflation factor is 2.0 percent. Fixed-route buscapital cost assumptions include the following. Adding $250,000 in bus stop improvements annually beginning in FY 2013. Adding a large remote parking and light maintenance facility in FY 2018. New revenue vehicles will consist of hybrid “diesel-electric” vehicles at a cost of $625,000 each. Thevehicle cost assumes fully-loaded hybrid vehicles. The spare ratio for revenue vehicles is 20 percent. The capital cost inflation factor for bus is 3.5 percent.RevenuesImplementation of the Vision Plan is predicated on a referendum seeking a one-cent sales tax for transitoccurring in 2011. Revenues are assumed to be available in FY 2011/2012. To move forward with areferendum, the Pinellas County Board of County Commissioners has to approve referendum language tobe placed on the voting ballot. The decision to proceed with the referendum would consider conclusionsdrawn from the AA undertaken with respect to a transit corridor connecting St. Petersburg and Clearwater.The sales tax revenues would be available for the planned bus service enhancements, light railinfrastructure and service, and other countywide infrastructure improvements.Sales tax revenues are based on projections from the Pinellas County Management and BudgetDepartment. Those projections are included in Appendix I. Estimated revenues in FY 2012 are $129Tindale-Oliver & Associates, Inc.Pinellas Suncoast Transit AuthoritySeptember 2010 7-17 Transit Development Plan
million. Sales tax revenues are to be put into a reserve account for future expenditure on rail constructionand to help support the acquisition of FTA New Starts funding. It is assumed that the Federal discretionaryfunding grant will provide 50 percent of the capital costs for rail.Other revenue assumptions for the Vision Plan include the following:The revenue inflation factor for all other revenues other than the sales tax is 2.0 percent.The farebox recovery ratio for bus is 23 percent.Beginning in 2020, the farebox recovery ratio for rail is 20 percent in the first year, 25 percent in thesecond year, and 30 percent in the third year and thereafter. That farebox recovery ratio is based onanalysis of other rail systems.Under these assumptions, it is possible for PSTAto begin offering customers significantly improvedbus service as well as light rail service. Whilebeyond the 10-year timeframe of the TDP, thepursuit of a sales tax referendum requires alonger-term financial view and implementationplan.Tables 7-5 and 7-6 present the operating andcapital budgets, respectively, for the Vision Planbased on the set of assumptions describedpreviously. Figures 7-7 through 7-9 illustrate thebalance of expenditures and revenues for operating, capital, and operating and capital combined,respectively. Rail and bus capital and operating expenses and revenues are differentiated in each five-yearphase of the Vision Plan. As shown in those tables, there is an overall surplus of $209 million over the 25-year planning horizon of the Vision Plan.Tindale-Oliver & Associates, Inc.Pinellas Suncoast Transit AuthoritySeptember 2010 7-18 Transit Development Plan
Table 7-525-Year Vision Plan – Operating BudgetFixed Route Bus 2011-15 2016-20 2021-25 2026-30 2031-35 25-Year TotalOperating CostsExisting Service $139,017,698 $0 $0 $0 $0 $139,017,698New Service $205,727,438 $538,331,043 $618,915,840 $683,333,098 $754,454,956 $2,800,762,376Total Costs $344,745,137 $538,331,043 $618,915,840 $683,333,098 $754,454,956 $2,939,780,074Operating RevenuesExisting SourcesFare Revenue - Existing $31,974,071 $0 $0 $0 $0 $31,974,071Auxiliary Revenue $1,072,410 $1,234,891 $1,363,419 $1,505,325 $1,662,000 $6,838,045Non-Transportation Revenue $2,846,025 $2,809,541 $3,101,960 $3,424,814 $3,781,272 $15,963,612Property Tax $26,425,140 $0 $0 $0 $0 $26,425,140State Reimbursement - Fuel Tax $2,712,223 $2,959,931 $3,268,003 $3,608,140 $3,983,678 $16,531,975State Grants $20,755,747 $22,916,022 $25,301,140 $27,934,503 $30,841,948 $127,749,359Pass-Thru Grant $404,832 $441,806 $487,789 $538,558 $594,612 $2,467,597Section 5307 & Other Federal Grants $39,008,223 $49,828,359 $63,595,016 $81,165,147 $103,589,580 $337,186,325New SourcesSales Tax for Bus $121,299,262 $224,174,983 $153,138,426 $202,812,483 $245,032,749 $946,457,902Transfer from Rail $0 $0 $51,646,107 $468,781,899 $512,518,709 $1,032,946,715Transfer from Bus Capital $0 $0 $0 $0 $35,890,676 $35,890,676Bond Issues $99,000,000 $142,065,000 $0 $0 $0 $241,065,000Debt Service ($19,412,038) ($60,209,670) ($78,780,519) ($78,780,519) ($78,780,519) ($315,963,264)Fare Revenue - New $47,317,311 $123,816,140 $142,350,643 $157,166,613 $173,524,640 $644,175,346Total Revenues $373,403,205 $510,037,002 $365,471,984 $868,156,962 $1,032,639,345 $3,149,708,499Revenues Minus Costs $28,658,069 ($28,294,041) ($253,443,856) $184,823,864 $278,184,389 $209,928,425Rollover from Prev. Year $0 $28,658,069 $364,028 ($253,079,828) ($68,255,964) $209,928,425Surplus/Shortfall $28,658,069 $364,028 ($253,079,828) ($68,255,964) $209,928,425 $209,928,425Light RailOperating CostsTotal $0 $24,051,512 $183,018,662 $301,346,914 $366,634,598 $875,051,686Operating RevenuesNew SourcesFare Revenue $0 $4,810,302 $53,654,920 $90,404,074 $109,990,379 $258,859,676Sales Tax for Rail $0 $19,241,210 $129,363,742 $210,942,840 $256,644,218 $616,192,010Transfer to Bus Operating $0Total $0 $24,051,512 $183,018,662 $301,346,914 $366,634,598 $875,051,686Revenues Minus Costs $0 $0 $0 $0 $0 $0Surplus/Shortfall $0 $0 $0 $0 $0 $0Notes1. Rail improvements are assumed to be light rail; however, mode choice would be determined through the AlternativesAnalysis process.2. To move forward with a referendum seeking a sales tax, the Pinellas County Board of County Commissioners has toapprove referendum language to be placed on the voting ballot.Tindale-Oliver & Associates, Inc.Pinellas Suncoast Transit AuthoritySeptember 2010 7-19 Transit Development Plan
Table 7-625-Year Vision Plan – Capital BudgetFixed Route Bus 2011-15 2016-20 2021-25 2026-30 2031-35 25-Year TotalCapital CostsExisting Service $49,255,880 $106,881,963 $58,287,342 $101,680,974 $118,243,694 $434,349,853New Service $160,477,520 $91,251,112 $174,310,178 $65,176,782 $1,250,000 $492,465,592Total $209,733,400 $198,133,076 $232,597,520 $166,857,756 $119,493,694 $926,815,445Capital RevenuesExisting SourcesSection 5307 & Other Federal Grants $58,512,335 $74,742,539 $95,392,524 $121,747,720 $155,384,370 $505,779,488Transfer to Bus $0 $0 $0 $0 ($35,890,676) ($35,890,676)New SourcesSales Tax for Bus $151,221,065 $123,390,537 $137,204,996 $45,110,036 $0 $456,926,634Total $209,733,400 $198,133,076 $232,597,520 $166,857,756 $119,493,694 $926,815,446Revenues Minus Costs $0 $0 $0 $0 $0 $0Rollover from Prev. Period $0 $0 $0 $0 $0 $0Capital Surplus/Shortfall $0 $0 $0 $0 $0 $0Light RailCapital CostsNew Service $103,957,780 $1,253,401,039 $754,262,698 $0 $0 $2,111,621,518Total $103,957,780 $1,253,401,039 $754,262,698 $0 $0 $2,111,621,518Capital RevenuesNew SourcesFederal New Starts Funding $51,978,890 $626,700,520 $377,131,349 $0 $0 $1,055,810,759Sales Tax for Rail $273,885,471 $404,793,939 $428,777,456 $468,781,899 $512,518,709 $2,088,757,474Transfer to Bus $0 $0 ($51,646,107) ($468,781,899) ($512,518,709) ($1,032,946,715)Total $325,864,361 $1,031,494,459 $754,262,698 $0 $0 $2,111,621,518Revenues Minus Costs $221,906,581 ($221,906,581) $0 $0 $0 $0Rollover from Prev. Period $0 $221,906,581 $0 $0 $0 $0Surplus/Shortfall $221,906,581 $0 $0 $0 $0 $0Notes1. Rail improvements are assumed to be light rail; however, mode choice would be determined through the AlternativesAnalysis process.2. To move forward with a referendum seeking a sales tax, the Pinellas County Board of County Commissioners has toapprove referendum language to be placed on the voting ballot.Tindale-Oliver & Associates, Inc.Pinellas Suncoast Transit AuthoritySeptember 2010 7-20 Transit Development Plan
Figure 7-725-Year Vision Plan – Operating Costs and RevenuesMillions$1,600$1,400$1,200$1,000$800$600$400$200OperatingCostsOperatingRevenues$-2011-15 2016-20 2021-25 2026-30 2031-35Figure 7-825-Year Vision Plan – Capital Costs and RevenuesMillions$1,600$1,400$1,200$1,000$800$600$400$200CapitalCostsCapitalRevenues$-2011-15 2016-20 2021-25 2026-30 2031-35Tindale-Oliver & Associates, Inc.Pinellas Suncoast Transit AuthoritySeptember 2010 7-21 Transit Development Plan
Millions$2,500$2,000Figure 7-925-Year Vision Plan – Combined Operating and Capital Costs and Revenues$1,500$1,000TotalCostsTotalRevenues$500$-2011-15 2016-20 2021-25 2026-30 2031-35HOWARD FRANKLAND BRIDGE RAIL SERVICE COSTSImproving transit in Pinellas County is a top priority for county officials. With the promise of HSR servicecoming to Hillsborough County, there is a need for Pinellas County residents to be able to connect to thatfuture service in order to create a true regionally-coordinated public transportation system. The south spanof the Howard Frankland Bridge is programmed for reconstruction beginning in FY 2024. It is at that timethat a light rail service spanning the Tampa Bay should also be implemented. The location of majoremployment and business centers at both ends of the Howard Frankland Bridge, i.e., Gateway andWestshore, presents an ideal opportunity for capturing the travel market between the two counties.The cost for reconstruction of the bridge is estimated to be $675 million, $475 million for a four-laneroadway with emergency lanes and an additional $200 million for the transit component, which would allowfor double tracks. Annual operating costs for the service over the bridge are estimated to be $3.5 million.Tindale-Oliver & Associates, Inc.Pinellas Suncoast Transit AuthoritySeptember 2010 7-22 Transit Development Plan
APPENDIX AFLEET INVENTORY AND REPLACEMENT SCHEDULETindale-Oliver & Associates, Inc.Pinellas Suncoast Transit AuthoritySeptember 2010 A-1 Transit Development Plan
PSTA REVENUE FLEET INVENTORYPSTA BUS FLEET INVENTORYManufacturer Year Made Number Length Seats Scheduled ReplacementNew Flyer 1997 14* 35' 30 2010Gillig 1999 8* 40' 40 2011Gillig 2002 4 29' 26 2012Gillig 2001 16 40' 40 2013Gillig 2002 10 40' 40 2014MCI 2003 10 40' 49 2015Gillig 2005 5 29' 26 2015Gillig 2005 8 40' 40 2017Gillig 2005 8 35' 37 2017Gillig 2006 36 40' 40 2018Gillig 2006 12 35' 37 2018Gillig 2007 11 40' 40 2019Gillig 2007 7 35' 37 2019Gillig 2008 15 40' 40 2020Gillig 2008 6 35' 37 2020Gillig (Hybrid BRT) 2009 3 35' 32 2021Gillig (Clean Diesel BRT) 2009 2 35' 32 2021Gillig (Hybrid BRT) 2010 14 35' 32 2022*16 buses will remain in a contingency fleet.Tindale-Oliver & Associates, Inc.Pinellas Suncoast Transit AuthoritySeptember 2010 A-2 Transit Development Plan
PSTA TROLLEY FLEET INVENTORYManufacturer Year Made Number Length SeatsGillig 2007 3 35' 37 2019Gillig 2008 6 35' 37 2020Gillig (Hybrid) 2009 7 35' 32 2021PSTA NON-REVENUE FLEET INVENTORYAUTOMOBILE FLEETMAKE YEAR PSTA # TYPE USAGEChevy 2001 211 Lumina Drivers ShuttleBuick 2002 221 Century Drivers ShuttleBuick 2002 222 Century Drivers ShuttleBuick 2002 223 Century Drivers ShuttleBuick 2002 224 Century Drivers ShuttleBuick 2002 227 Century Drivers ShuttleBuick 2003 231 Century Drivers ShuttleBuick 2003 232 Century Drivers ShuttleBuick 2003 234 Century Drivers ShuttleBuick 2003 235 Century Drivers ShuttleBuick 2005 251 Century Drivers ShuttleBuick 2005 252 Century Drivers ShuttleBuick 2005 254 Century Drivers ShuttleBuick 2005 256 Century Drivers ShuttleBuick 2005 257 Century Drivers ShuttleBuick 2005 258 Century Drivers ShuttleBuick 2005 253 Century Drivers ShuttleBuick 2005 255 Century Drivers ShuttleChevy 2006 262 Malibu Drivers ShuttleChevy 2006 265 Malibu Drivers ShuttleChevy 2006 261 Malibu Drivers ShuttleChevy 2006 264 Malibu Drivers ShuttleTindale-Oliver & Associates, Inc.Pinellas Suncoast Transit AuthoritySeptember 2010 A-3 Transit Development Plan
PSTA SUPERVISOR AND SERVICE VEHICLE FLEET INVENTORYMAKE YEAR PSTA # TYPE USAGEChevy 2006 263 Malibu DartChevy 2006 267 Malibu Maintenance Amenities ProjectChevy 2006 266 Malibu Road SupervisorChevy 2006 268 Malibu Road SupervisorChevy 2006 269 Malibu Road SupervisorChevy 2006 270 Malibu Road SupervisorChevy 2006 271 Malibu Road SupervisorChevy 2006 272 Malibu Road SupervisorChevy 2010 101 Cobalt Safety & TrainingChevy 2010 102 Cobalt Transportation/MaintenanceChevy 2010 103 Cobalt PoolChevy 2010 104 Cobalt PoolChevy 2010 105 Cobalt PoolChevy 2010 106 Cobalt PoolPSTA SUPPORT VEHICLE FLEET INVENTORYMAKE YEAR PSTA # TYPE USAGEFord 1985 14 Truck Maintenance DepartmentFord 2006 26 Utility Truck Maintenance DepartmentFord 2009 29 Pickup Maintenance DepartmentDodge 2002 2253 Van Maintenance DepartmentDodge 1999 9950 Van Parts VanDodge 1999 9951 Pickup Shop TruckDodge 1999 9952 Pickup Shop TruckGMC 1995 9525 Panel Tk Facilities MaintenanceDodge 2001 2150 Maxi Van Facilities MaintenanceDodge 2001 2151 Maxi Van Facilities MaintenanceDodge 2002 2250 Maxi Van Facilities MaintenanceDodge 2002 2251 Van Facilities MaintenanceDodge 2002 2252 Van Facilities MaintenanceFord 2008 28 Van MarketingTindale-Oliver & Associates, Inc.Pinellas Suncoast Transit AuthoritySeptember 2010 A-4 Transit Development Plan
PSTA FLEET REPLACEMENT SCHEDULE12 YEAR BUS AND TROLLEY REPLACEMENT SCHEDULEYearFleetVehiclesin FleetVehiclesto beReplacedTotalVehiclesto beReplacedVehicle AgeatReplacementAverageAge forTotalFleet20111997 Contingency 14 08141999 Gillig 40' 8 8 122012 2002 Gillig 29' 4 4 4 10 6.522013 2001 Gillig 40' 16 16 16 12 7.322014 2002 Gillig 40' 10 10 10 12 7.1120152003 MCI 40' 10 1015122005 Gillig 29' 5 5 102016 N/A N/A 0 0 N/A 7.702017201820192005 Gillig 35' 8 816122005 Gillig 40' 8 8 122006 Gillig 35' 12 1248122006 Gillig 40' 36 36 122007 Gillig 35' 7 7122007 Gillig 40' 11 11 21122007 Gillig Trolley 35' 3 3 122008 Gillig 35' 6 6122020 2008 Gillig 40' 15 15 2712 6.312008 Gillig Trolley 35' 6 6 122009 Gillig BRT 35' 2 2122021 2009 Gillig Hybrid 35' 3 3 1212 5.662009 Gillig Trolley Hybrid 35' 7 7 122022 2010 Gillig 35' 14 14 14 12 5.94Totals * 205 191* Fourteen buses to remain in the contingency fleet.Full size 35' & 40' buses are replaced on a 12-year useful life cycle, while 29' buses are replaced on a 10-yearuseful life cycle.Note: Shaded rows indicate replacement scheduled after the timeframe of the 10-year TDP.5.997.538.708.496.61Tindale-Oliver & Associates, Inc.Pinellas Suncoast Transit AuthoritySeptember 2010 A-5 Transit Development Plan
12 YEAR SUPPORT VEHICLE REPLACEMENT SCHEDULEYearFleetAutomobilesin FleetAutomobilesto beReplacedTotalAutomobilesto beReplacedVehicle AgeatReplacementAverageAge forTotal Fleet2001 3 3102011 2002 4 4 1095.672003 3 3 82012 2005 8 8 8 7 4.172013 2006 12 12 12 7 3.612014N/AN/AN/A 2.282015No VehiclesReplacedN/A N/A 0N/A 3.282016 N/A N/A N/A 4.282017 2010 6 6 6 7 5.282018 2011 10 10 10 7 5.112019 2012 8 8 8 7 4.172020 2013 12 12 12 7 3.612021 No Vehicles N/A N/A N/A 2.282022 Replaced N/A N/A 0 N/A 3.28Totals 36Note: Shaded rows indicate replacement scheduled after the timeframe of the TDP.Support vehicles are replaced on a 7-year useful life cycle.Tindale-Oliver & Associates, Inc.Pinellas Suncoast Transit AuthoritySeptember 2010 A-6 Transit Development Plan
APPENDIX BPROGRAM OF PROJECTSTindale-Oliver & Associates, Inc.Pinellas Suncoast Transit AuthoritySeptember 2010 B-1 Transit Development Plan
SECTION 5307 FORMULA FUNDSFY 2010 PROGRAM OF PROJECTSPreventative Maintenance $8,800,000Tire Lease $450,000Bus Parts and Shop Labor $8,350,000Security Services and Concrete Enhancement $2,160,000Contracted Security at Passenger Terminals $160,0002" Additional/Enhanced Concrete/Scherer Drive $2,000,000Passenger Amenities and Real Time Information $350,000Passenger Landing Pads and Accessibility Features $250,000Real-Time Passenger Information/Project Management $100,000Contingency, Administration, and Transit Studies $422,407Contingency $155,083Administration $117,324Short Range Planning $150,000TOTAL $11,732,407Tindale-Oliver & Associates, Inc.Pinellas Suncoast Transit AuthoritySeptember 2010 B-2 Transit Development Plan
APPENDIX CARRA PROGRAM OF PROJECTSTindale-Oliver & Associates, Inc.Pinellas Suncoast Transit AuthoritySeptember 2010 C-1 Transit Development Plan
ADOPTED FY 2009 AMERICAN RECOVERY AND REINVESTMENT ACT (ARRA)PROGRAM OF PROJECTSPURCHASE FOURTEEN (14) 35’ HYBRID-ELECTRIC REPLACEMENT BUSES: $8,277,000Purchase of fourteen (14) 35’ hybrid-electric replacement buses. These buses will replace ten 1997 Series9700 buses and four CNG Series 9800 buses, which are eligible for replacement under FTA useful liferequirements.REAL-TIME BUS INFORMATION: $5,540,159PSTA will purchase a new Automatic Vehicle Location (AVL) system that will include annunciators for allbuses, real-time passenger information, and all amenities needed to support and run the new system. Thepassenger amenities will include predicted arrival times at terminals and transfer centers using informationmessage boards. Passengers will also be able to access predicted arrival times remotely using PDA's, cellphones, and other electronic devices.BUS STOP IMPROVEMENTS: $1,000,000PSTA has identified approximately 600 bus stops that require improvements. The improvements includecurbs, curb ramps, curb cuts, boarding and alighting areas, hand rails, drainage culverts, and bike racks.OPERATING ASSISTANCE: $263,000PROJECT ADMINISTRATION: $10,000TOTAL SECTION 5307 (ARRA): $15,090,159Tindale-Oliver & Associates, Inc.Pinellas Suncoast Transit AuthoritySeptember 2010 C-2 Transit Development Plan
APPENDIX DOPERATING AND CAPITAL BUDGET PROJECTIONSTindale-Oliver & Associates, Inc.Pinellas Suncoast Transit AuthoritySeptember 2010 D-1 Transit Development Plan
THREE-YEAR OPERATING BUDGET PROJECTIONSFiscal Fiscal Fiscal FiscalYear Year Year Year2010 2011 2012 2013Operating RevenuesPassenger Fares $ 10,884,620 $ 11,464,980 $ 11,694,280 $ 11,928,166Auxiliary Revenue 184,800 184,800 203,280 223,608Non-Transportation Revenue 202,820 664,880 624,203 508,738Property Tax 29,734,820 26,425,140 25,103,883 25,103,883Local Beach Trolley 600,000 600,000 600,000 600,000State Reimbursement - Fuel Tax 591,980 535,970 535,970 535,970State Grants 3,859,010 3,988,391 4,068,159 4,149,522Federal Grants 8,275,520 8,258,437 8,671,359 9,104,927Pass-Thru Grant 80,000 80,000 80,000 80,000Transfer From Reserves 350,000 2,299,144 4,823,388 6,271,464Total Operating Revenue 54,763,570 54,501,742 56,404,522 58,506,278Operating ExpensesSalaries 24,525,902 24,481,150 25,215,585 25,972,052Fringe Benefits 10,494,758 10,678,962 10,993,995 11,323,815Services 2,907,329 2,618,710 2,723,458 2,832,397Diesel Fuel 5,174,300 5,016,150 5,517,765 6,069,542Supplies 3,265,100 3,178,870 3,306,025 3,438,266Insurance 1,461,460 1,514,200 1,574,768 1,637,759Utilities 826,500 892,560 928,262 965,393Taxes & Licenses 782,260 708,490 708,490 708,490Purchased Transportation 4,870,991 4,980,140 5,099,663 5,222,055Miscellaneous 380,350 432,510 336,510 336,510Total Operating Expense 54,688,950 54,501,742 56,404,522 58,506,278Revenues Over/(Under) Expenses $ 74,620 $ 0 $ 0 $ 0ReservesCash and Receivables Less Payables $ 28,510,429 $ 31,210,130 $ 25,436,905 $ 20,613,517Less:Excess Insurance Coverage (2,000,000) (2,000,000) (2,000,000) (2,000,000)Operating Reserve (13,718,160) (9,083,624) (9,400,754) (9,751,046)Budget Excess/(Deficit) 74,620 (2,299,144) (4,823,388) (6,271,464)ContingenciesAlternatives Analysis (2,000,000) (666,667) 0 0Capital Asset Acquisition (1,290,359) (10,884,806) (9,212,763) (2,591,007)Future Budget Contingency 0 (2,335,392) 0 0Concrete Replacement (9,226,530) (3,940,497) 0 0Transfer to Operations (350,000) 0 0 0(28,510,429) (31,210,130) (25,436,905) (20,613,517)Balance $ 0 $ 0 $ 0 $ 0Tindale-Oliver & Associates, Inc.Pinellas Suncoast Transit AuthoritySeptember 2010 D-2 Transit Development Plan
TEN-YEAR CAPITAL BUDGET PROJECTIONSFiscal Year2010 2011 2012 2013 2014 2015 2016 2017 2018 2019 2020RevenueAmerican Recovery and Reinvestment Act $ 15,090,159 0 0 0 0 0 0 0 0 0 0Section 5307 Formula Grant 11,794,877 12,384,621 13,003,852 13,654,044 14,336,747 15,053,584 15,806,263 16,596,576 17,426,405 18,297,725 19,212,612Transfer to Operating Budget (6,249,420) (3,034,265) (3,156,874) (3,284,450) (3,417,193) (3,555,315) (3,699,033) (3,848,575) (4,004,177) (4,166,087) (4,334,560)Total Capital Revenue 20,635,616 9,350,355 9,846,977 10,369,595 10,919,553 11,498,269 12,107,231 12,748,002 13,422,228 14,131,639 14,878,052ExpendituresBuses 8,400,000 5,200,000 2,730,000 11,466,000 7,524,563 11,851,186 0 13,936,995 43,901,533 20,167,267 27,225,808Automobiles 90,000 157,500 132,300 208,373 0 0 0 126,642 221,620 186,160 293,196Software 5,810,000 170,000 225,000 0 0 2,585,000 0 250,000 0 0 0Hardware 504,500 1,103,000 1,200,000 150,000 100,000 1,538,000 2,200,000 0 0 0 2,100,000Support Equipment 1,036,000 187,602 0 0 0 0 1,100,000 0 0 0 1,100,000Passenger Amenities 3,342,500 123,846 130,039 136,540 143,367 150,536 158,063 165,966 174,264 182,977 192,126Project Administration & Transit Studies 835,159 0 0 0 0 0 0 0 0 0 0Contingency 617,457 619,231 650,193 682,702 716,837 752,679 790,313 829,829 871,320 914,886 960,631Total Capital 20,635,616 7,561,179 5,067,531 12,643,616 8,484,767 16,877,401 4,248,376 15,309,431 45,168,738 21,451,290 31,871,761Revenues Over (Under) Expenditures $ 0 1,789,176 4,779,446 (2,274,021) 2,434,786 (5,379,132) 7,858,855 (2,561,429) (31,746,509)(7,319,652) (16,993,709)Transfer to Operating Budget CalculationBus Parts $ 1,955,280 2,033,491 2,114,831 2,199,424 2,287,401 2,378,897 2,474,053 2,573,015 2,675,936 2,782,973 2,894,292Tire Lease 550,000 572,000 594,880 618,675 643,422 669,159 695,925 723,762 752,713 782,821 814,134Preventative Maintenance Labor 3,386,700 0 0 0 0 0 0 0 0 0 0Security Services 293,200 304,928 317,125 329,810 343,003 356,723 370,992 385,831 401,264 417,315 434,008Administration 64,240 123,846 130,039 136,540 143,367 150,536 158,063 165,966 174,264 182,977 192,126Total Operating Costs $ 6,249,420 3,034,265 3,156,874 3,284,450 3,417,193 3,555,315 3,699,033 3,848,575 4,004,177 4,166,087 4,334,560Tindale-Oliver & Associates, Inc. Pinellas Suncoast Transit AuthoritySeptember 2010 D-3 Transit Development Plan
APPENDIX EFAREBOX RECOVERY REPORTTindale-Oliver & Associates, Inc.Pinellas Suncoast Transit AuthoritySeptember 2010 E-1 Transit Development Plan
2010 ANNUAL FAREBOX RECOVERY REPORTHB 985, passed in 2007, requires that PSTA monitor its farebox recovery ratio. The rule also requires thatPSTA “specifically address potential enhancements to productivity and performance which would have theeffect of increasing farebox recovery ratio.” This section contains farebox recovery ratio calculations alongwith potential enhancements.CURRENT FAREBOX RECOVERY RATIOThe following section contains a calculation of farebox recovery over time. Farebox recovery was 22.3percent in FY 2008/09.Table E-1Farebox Recovery (FY 1995/96 to FY 2008/09)Fiscal Year Total ExpensesFare FareboxRevenue Recovery1995/96 $24,351,920 $5,670,117 23.3%1996/97 $24,136,823 $6,106,522 25.3%1997/98 $24,483,123 $6,656,894 27.2%1998/99 $24,155,732 $6,938,031 28.7%1999/00 $26,369,717 $7,562,815 28.7%2000/01 $28,706,597 $7,747,691 27.0%2001/02 $29,917,237 $7,817,301 26.1%2002/03 $32,832,830 $7,985,832 24.3%2003/04 $35,676,304 $8,060,506 22.6%2004/05 $37,982,193 $8,252,157 21.7%2005/06 $46,025,915 $9,045,137 19.7%2006/07 $48,418, 065 $10,717,941 22.1%2007/08 $50,981,021 $11,298,758 22.6%2008/09 $51,494,018 $11,500,513 22.3%These expenses are based upon financial audit reports and exclude depreciation and purchasedtransportation expenses..Tindale-Oliver & Associates, Inc.Pinellas Suncoast Transit AuthoritySeptember 2010 E-2 Transit Development Plan
EFFECTIVE FARE CHANGESThe following section provides a listing of the enhancements PSTA is undertaking to enhance the fareboxrecovery ratio.Fare increase: PSTA implemented a fare increase in October 2008, which helped increase thefare recovery ratio.Monitoring: PSTA continuously monitors its performance to determine whether adjustments needto be made. In October 2008, PSTA undertook a five percent reduction in service in order tostreamline operations. This streamlining helped increase the farebox recovery ratio.Public Input: PSTA continuously seeks input from the public. The input provides valuableinformation on how to make services more convenient and useful to patrons. By providing servicesthat better meet the needs of its customers, PSTA can increase ridership. Increasing ridership canincrease farebox recovery. PSTA has an open-door policy with regard to public input; publiccomments are always welcome.Paratransit: PSTA will continue to increase ridership by transitioning passengers from paratransitservice to fixed-route service. Marketing: PSTA’s vigorous marketing campaign, which includes television and printadvertisements, helps bring in additional passengers and revenue.Cost Containment: PSTA is continuing to working to limit expenses where possible, to helpincrease the farebox recovery ratio.Tindale-Oliver & Associates, Inc.Pinellas Suncoast Transit AuthoritySeptember 2010 E-3 Transit Development Plan
APPENDIX FOCTOBER 2010 SERVICE ADJUSTMENTSTindale-Oliver & Associates, Inc.Pinellas Suncoast Transit AuthoritySeptember 2010 F-1 Transit Development Plan
ApprovedFareModificationstobeeffective10/3/10FareTypeCurrentFareApprovedModificationsFullCashFare $1.75 $2.00ReducedCashFare $.85 $1.00DailyUnlimitedGOCard $4.00 $4.50ReducedDailyUnlimitedGOCard $2.00 $2.2531DayUnlimitedGOCard $55.00 $65.00DARTCashFare $3.50 NochangeDART1Ride $3.50 NochangeDART10Ride $35.00 NochangeAdultStudentCashFare $1.25 NochangeReduced31DayUnlimitedGOCard $35.00 NochangeYouthCashFare $1.25 NochangeRoute100X/300XCash $3.00 Nochange20RidePremium $48.00 Nochange7DayUnlimitedGOCard $20.00 NochangePassport $85.00 Nochange7DayYouthPlatinumGOCard $12.50 NochangeSummerYouthHaulPass $35.00 Nochange
ApprovedServiceModificationsasofJuly28,2010Tobeeffective10/3/2010BusRouteDescriptionofProposedChangesSuncoastBeachTrolley SMWeekday,Saturday,Sunday:Eliminate5:15amnorthboundtripfromBeachWalktoParkStreetTerminal.SaturdayandSunday:Eliminate5:15amnorthboundtripfrom75th&GulfBlvdtoParkStreetTerminal.Sunday:Eliminate5:30amnorthboundtripfrom75th&GulfBlvdtoParkStreetTerminal.Route1Weekday&Saturday:Four(4)a.m.andthree(3)p.m.tripswillserveNortheastShoppingCentertoTyroneSquareMall.Servicewillbeprovidedfive(5)middaytripstoGatewayMall.Route4Weekday:EliminateCoquinaKeyLoopnorthboundat5:40am,8:40pm,and9:40pm;andsouthboundat8:55pm,and9:55pmSaturday:EliminateCoquinaKeyLoopnorthboundat5:40am,8:40pm,and9:35pm;andsouthboundat5:55am,8:50pm,and9:45pmRoute5Weekday:Eliminate5:30amwestboundtripfromGrandCentralStationtoTyroneSquareMall.Route18Weekday:Eliminate5:15amnorthboundtripfromMissouriAve&RoserytoParkStreetTerminal.Eliminate5:05amsouthboundtripfromGrandCentralStationtoWilliamsPark.Startthecurrent5:25amand5:45amsouthboundtrips5minuteslater.Saturday:Changethecurrent5:40amnorthboundtripfromMissouriAve&RoserytoParkStreetTerminalandstarttripat5:45am.Sunday:Eliminate7:05amsouthboundtripandstartrouteatWilliamsParkat7:15am.Route19Weekday:Eliminate5:50amsouthboundtrip.Startrouteat46Ave&34StSat6:05am.WillnotserveEckerdCollegesouthboundat10:20pm.Thesouthbound9:00pmtripwillendatGrandCentralStationinsteadof46AveS&34StS.Eliminate10:55pmnorthboundtrip.Saturday:WillnotserveEckerdCollegesouthboundat10:20pm.Eliminatethenorthbound10:25pmtrip.Route30Weekday&Saturday:Servicewillprovidethree(3)a.m.peaktripsandthree(3)p.m.peaktrips.Route35Weekday,Saturday&Sunday:Eliminatemiddayservicebetween10a.m.and5p.m.betweenWilliamsParkandGrandCentralStation.ServiceisduplicatedbytheCityofSt.Petersburg'sCentralAvenueShuttleduringthatperiod.ServicefromGrandCentraltothebeachwillcontinueascurrentlyprovided.Route38WeekdayandSaturday:Eliminate6:00ameastboundtripfrom38Ave&58SttoWilliamsPark.StartrouteatWilliamsParkat6:30am.Route52Weekday:Eliminate4:45amnorthboundtripfrom49St&140Ave.StartrouteatWhitneyRdNat4:55am.EliminatenorthboundservicetoPSTAFacility34thStat10:00pm,10:30pm,and10:55pm.EliminatesouthboundservicetoPSTAFacility34thStat10:00pm,11:00pm,and11:40pm.
Route58Route59Route74Route75Route79Route93Weekday:ServicebetweenSeminoleMallandGulfBlvdtobeeliminated;Middayservice(offpeak)tobeeliminated,four(4)morningrushhourandfive(5)eveningrushhourtripswouldremain.ServicebetweenSeminoleMallandOakhurstRdisprovidedbyRoute74.PassengersbetweenParkBlvdandOakhurstwillneedtotransferatIndianRocksShoppingCenter.Saturday:serviceeliminated.Sunday&Holidays:serviceeliminated.Weekday:WestboundtripsendatIndianRocksShoppingCenterat8:20pmand8:50pm;eliminatesserviceto1St&4Ave.Eastbound8:25pm,and8:55pmtripswillstartatIndianRocksShoppingCenter.Saturday:WestboundtripsendatIndianRocksShoppingCenterat8:20pm,and9:15pm;eliminatesserviceto1St&4Ave.Sunday:Eliminatethewestbound5:20amtripandtheeastbound5:55amtripbetween1St&4AveandUlmertonRd&US19.Routewillstartat6:28amatUlmertonRoad&US19.Westbound8:45pmtripendsatIndianRocksShoppingCenter,andreturnseastboundat8:45pm.Weekday:Eastboundtripsat5:25amand5:45amwillstartatSeminoleMall.EliminateservicebetweenSeminoleMallandIndianRocksShoppingCenter.Eastboundtripsat8:20pmand8:50pmwillendatSeminoleMall.EliminateservicebetweenSeminoleMallandIndianRocksShoppingCenter.Eastbound8:55pmand9:20pmtripswillendatShoppesatParkPlace(ratherthanGatewayMall).Westbound6:00am,6:20am,7:50pm,and8:20pmtripswillendatSeminoleMall(ratherthanIndianRocksShoppingCenter).Saturday:Eastbound5:45amtripwillstarttripatSeminoleMall(ratherthanIndianRocksShoppingCenter).Eastbound8:20pmtripwillendatShoppesatParkPlace(ratherthanGatewayMall).Westbound6:25amwillend,and7:25pmtripswillstartandendatSeminoleMall(ratherthanIndianRocksShoppingCenter).Sunday:Westbound6:30pmtripwillendatSeminoleMall(ratherthanIndianRocksShoppingCenter).Sunday:Eliminate6:25ameastboundtrip.Weekday,Saturday,Sunday&Holidays:ServicetoPalmsofPasadenaHospitalwillbereinstated.Routeeliminated:WeekdayservicetoNielsenandnearbyfacilitiesinOldsmarwillbeprovidedbyRoute67onthree(3)a.m.peaktripsandtwo(2)p.m.peaktrips.
APPENDIX GHISTORY OF PSTATindale-Oliver & Associates, Inc.Pinellas Suncoast Transit AuthoritySeptember 2010 G-1 Transit Development Plan
HISTORY OF PSTASPECIAL LEGISLATIVE ACT/ ENABLING LEGISLATIONPrior to 1970: St. Petersburg Municipal Transit System (SPMTS) operates transit service in St.Petersburg Area.1970: State legislature creates Central Pinellas Transit Authority (CPTA).1971: Referendum passes creating CPTA as an independent transit authority with taxingcapabilities.1973: CPTA initiates service with 23 buses, nine routes serving eight cities.1980: Study initiated regarding the possible merger of CPTA and SPMTS. Both systems havealready developed intersystem transfers at common destination points, common fares, andinformation telephone numbers.1982: Florida Legislature approved merger to form the Pinellas Suncoast Transit Authority(PSTA) with operations funded by a tax levy in service areas. The merger requiresratification by popular vote; referendum passes in St. Petersburg, Gulfport, and SouthPasadena, but fails in North County.1983: The merger proposal is put back on the ballot in the North County area and passes.1984: The Pinellas Suncoast Transit Authority becomes the county public transit provider,serving 19 of 24 municipal jurisdictions and most unincorporated areas. Residents in fivecities and two unincorporated areas do not belong to the authority and are exempt from thePSTA tax levy. These communities are Belleair Beach, Belleair Shores, Kenneth City,Treasure Island, St. Pete Beach, Terra Verde (unincorporated) and South Pasadena(unincorporated).1994: Sullivan Bill: Provides for non-member and non-participating communities to haverepresentation on the PSTA Board. Board membership totals eleven, with nine electedand two non-elected members, representing 24 municipalities and unincorporated areas.1999: Legislation was passed clarifying that PSTA is an “Independent Special District”, not a“Dependent Special District”.Tindale-Oliver & Associates, Inc.Pinellas Suncoast Transit AuthoritySeptember 2010 G-2 Transit Development Plan
2003: A governance committee comprised of three County Commissioners and three CityOfficials recommended a countywide transit authority. The committee suggestion isendorsed by the Board of County Commissioners, who ask State Senator Jim Sebesta toclear the way for a countywide authority and amend PSTA’s Special Act. If approved in acountywide referendum, all Pinellas County property owners would be required to pay thePSTA tax.2006: HB 931 and SB 2236 work their way through the State Legislature. These companion billsamend PSTA’s Special Act to increase PSTA’s Board size from 11 to 15 members,including three new County Commissioner positions. The legislation is signed into law inJune.Tindale-Oliver & Associates, Inc.Pinellas Suncoast Transit AuthoritySeptember 2010 G-3 Transit Development Plan
APPENDIX HVision Plan Selected Capital Cost AssumptionsTindale-Oliver & Associates, Inc.Pinellas Suncoast Transit AuthoritySeptember 2010 H-1 Transit Development Plan
Table H-1Transfer Facility CostsTransfer Facility ComponentConstruction CostsSite Work $809,000Ticket Booth $134,000Inner Canopies $365,000Outer Canopies $240,000Construction Total $1,548,000*Source: PSTA Opinion of Probable CostTable H-2Intermodal Facility CostsIntermodal Facility ComponentConstruction CostsSite Work $4,774,000Ticket Booth and Restrooms, etc. for Transportation Functions $1,347,000Parking Garage and Support Structures $4,774,000Retail and Community Support Structures $1,480,000Inner Canopies $852,000Outer Canopies $2,400,000Construction Total $15,626,000*Source: PSTA Opinion of Probable CostTable H-3Park-and-Ride Facility CostsPark-and-Ride Facility ComponentConstruction CostsBase Material, Asphalt, and Curb and Gutter $73,000Pavement Marking $5,000Light Poles $21,000Right of Way $432,000Construction Total $531,000*Source: PSTA Opinion of Probable Cost. Modeled after the existing Ulmerton Road park-and-ride facility.Tindale-Oliver & Associates, Inc.Pinellas Suncoast Transit AuthoritySeptember 2010 H-2 Transit Development Plan
Table H-4Light Rail Station Costs*Light Rail Facility ComponentConstruction CostsSite Work and Structures $647,000Ticket Vending Machine $57,000Rider Amenities $260,000Construction Total $963,000*Light rail station costs are based on comparable construction costs for the Charlotte, NC Blue Line Extension.Table H-5Light Rail Capital CostsLight Rail Capital ComponentConstruction CostsGuideway and track elements $356,000,000Stations, stops, and terminals $26,000,000Support facilities: yard and shop $21,500,000Sitework and special conditions $247,000,000Systems $191,000,000ROW $196,000,000Vehicles $136,000,000Professional services $306,000,000Total Construction Cost $1,480,000,000Contingency 25%Total Construction with Contingency $1,850,000,000Miles of Light Rail26 MilesCost Per-Mile with Contingency $71,000,000*Light rail costs are based on comparable construction costs for the Charlotte, NC Blue Line Extension.Tindale-Oliver & Associates, Inc.Pinellas Suncoast Transit AuthoritySeptember 2010 H-3 Transit Development Plan
APPENDIX IPINELLAS COUNTY MANAGEMENT & BUDGETONE-CENT SALES TAX REVENUE PROJECTIONSTindale-Oliver & Associates, Inc.Pinellas Suncoast Transit AuthoritySeptember 2010 I-1 Transit Development Plan
Third Penny for Pinellas, Local Infrastructure Sales SurtaxEstimated Annual Distributions to Pinellas County and MunicipalitiesFebruary, 2010 through January, 2020(Amounts in Thousands, 000's omitted)Current & ThirdPenny Estimate Estimate Estimate Estimate Estimate Estimate Estimate Estimate Estimate Estimate Estimate Estimate %FY 10 FY 10 FY 11 FY 12 FY 13 FY 14 FY 15 FY 16 FY 17 FY 18 FY 19 FY 20 Total AllocationCriminal Justice & related facilities 15,250 15,000 22,500 22,500 22,500 22,500 22,500 22,500 22,500 22,500 22,500 7,500 225,000 N/APinellas County 55,550 38,086 53,301 55,904 58,611 60,723 62,898 65,138 66,676 68,245 69,845 23,826 623,252 52.3326%Total Pinellas County 70,800 53,086 75,801 78,404 81,111 83,223 85,398 87,638 89,176 90,745 92,345 31,326 848,2527.1% 3.4% 3.5% 2.6% 2.6% 2.6% 1.8% 1.8% 1.8%Belleair 310 216 302 317 333 345 357 370 378 387 396 135 3,536 0.2969%Belleair Beach 135 86 120 126 132 137 142 147 150 154 157 54 1,405 0.1180%Belleair Bluffs 170 118 165 173 181 188 195 202 206 211 216 74 1,929 0.1619%Belleair Shore 5 4 5 6 6 6 6 6 7 7 7 2 62 0.0052%Clearwater 8,156 5,805 8,124 8,520 8,933 9,255 9,586 9,928 10,162 10,401 10,645 3,631 94,991 7.9761%Dunedin 2,773 1,958 2,740 2,874 3,013 3,122 3,234 3,349 3,428 3,509 3,591 1,225 32,044 2.6907%Gulfport 953 677 947 993 1,041 1,079 1,117 1,157 1,185 1,212 1,241 423 11,073 0.9297%Indian Rocks Beach 374 278 389 408 428 444 459 476 487 499 510 174 4,553 0.3823%Indian Shores 129 94 132 139 145 151 156 162 165 169 173 59 1,546 0.1298%Kenneth City 341 239 334 351 368 381 394 408 418 428 438 149 3,908 0.3282%Largo 5,394 3,831 5,362 5,624 5,896 6,108 6,327 6,553 6,707 6,865 7,026 2,397 62,696 5.2644%Madeira Beach 336 237 332 348 365 378 391 405 415 425 435 148 3,878 0.3256%N. Redington Beach 108 81 114 119 125 129 134 139 142 145 149 51 1,329 0.1116%Oldsmar 926 723 1,012 1,061 1,112 1,152 1,194 1,236 1,265 1,295 1,325 452 11,828 0.9931%Pinellas Park 3,534 2,503 3,503 3,674 3,852 3,991 4,134 4,281 4,382 4,485 4,590 1,566 40,960 3.4393%Redington Beach 122 84 117 123 129 134 138 143 147 150 154 52 1,371 0.1151%Redington Shores 180 123 172 181 190 196 203 211 216 221 226 77 2,016 0.1692%Safety Harbor 1,307 937 1,311 1,375 1,441 1,493 1,547 1,602 1,640 1,678 1,718 586 15,326 1.2869%St. Petersburg 13,532 13,312 18,630 19,540 20,486 21,224 21,984 22,767 23,305 23,854 24,413 8,328 217,844 18.2917%St. Petersburg Beach 6,156 526 737 773 810 839 869 900 921 943 965 329 8,614 0.7233%Seminole 1,157 936 1,311 1,375 1,441 1,493 1,547 1,602 1,639 1,678 1,717 586 15,325 1.2868%South Pasadena 444 307 430 451 473 490 507 525 538 550 563 192 5,026 0.4220%Tarpon Springs 1,659 1,219 1,706 1,789 1,876 1,944 2,013 2,085 2,134 2,184 2,236 763 19,950 1.6751%Treasure Island 568 396 555 582 610 632 654 678 694 710 727 248 6,485 0.5445%Municipalities Subtotal 48,768 34,691 48,549 50,920 53,386 55,310 57,291 59,331 60,732 62,161 63,619 21,702 567,693 47.6674%Total 119,568 87,777 124,350 129,324 134,497 138,532 142,688 146,969 149,908 152,906 155,965 53,028 1,415,945 100.0000%4.0% 4.0% 4.0% 3.0% 3.0% 3.0% 2.0% 2.0% 2.0% 2.0%Notes:The above distribution of Local Infrastructure Sales Surtax is based on the following assumptions:1. The annual growth rate in total receipts is 4.0% for FY2011 through FY2013; 3% for FY2014 through FY2016; and 2% for FY2017 through FY2020.2. The allocation of receipts toward Criminal Justice and related facilities is set for $225 Million for the 10 year extension period.3. The distribution percentages to Pinellas County and the municipalities are determined utilizing 2004 population estimates projected by the Bureau of Economic and Business Research.4. The first column of Actuals for FY10 reflects the amounts collected and distributed for both the current Extended Penny and the Third Penny.The second column of Actuals for FY10 (included in the Total column) only reflects the amount collected and distributed for the Third Penny.5. Budget estimates for FY11 through FY20 will reflect the above estimates less the statutory 5% reduction required.6. The revenue generated by a sales tax is extremely sensitive to economic conditions. The projection is based upon continued economic growth in Pinellas County and is subject to changes in the national economy.Projections may be revised from time to time.H:\USERS\FUNDS\0408\Penny Distribution Formulas 1990 to 2020 Third Penny 8/20/2010 4:40 PM
Extended Penny for Pinellas, Local Infrastructure Sales SurtaxHistorical and Estimated Annual Distributions to Pinellas County and MunicipalitiesFebruary, 2000 through January, 2010(Amounts in Thousands, 000's omitted)Extended & OriginalPenny Actual Actual Actual Actual Actual Actual Actual Actual Actual Actual Actual Estimate %FY 00 FY 00 FY 01 FY 02 FY 03 FY 04 FY 05 FY 06 FY 07 FY 08 FY 09 FY 10 Total AllocationCriminal Justice & related facilities 8,000 5,333 8,667 8,000 8,000 8,000 8,000 8,000 8,000 8,000 8,000 2,000 80,000 N/APinellas County 54,417 35,679 61,114 56,936 57,334 60,991 67,659 69,462 67,478 64,133 58,873 15,704 615,363 52.7320%Total Pinellas County 62,417 41,012 69,781 64,936 65,334 68,991 75,659 77,462 75,478 72,133 66,873 17,704 695,3635.6% 9.7% 2.4% -2.6% -4.4% -7.3%Belleair 330 214 367 342 344 366 406 417 405 385 353 94 3,693 0.3164%Belleair Beach 161 112 192 178 180 191 212 218 212 201 185 49 1,929 0.1653%Belleair Bluffs 190 118 201 188 189 201 223 229 222 211 194 52 2,027 0.1737%Belleair Shore 5 3 5 5 5 5 6 6 6 6 5 1 55 0.0047%Clearwater 8,270 5,352 9,150 8,524 8,584 9,132 10,130 10,400 10,103 9,602 8,814 2,351 92,142 7.8950%Dunedin 2,869 1,854 3,170 2,953 2,974 3,164 3,510 3,603 3,500 3,327 3,054 815 31,925 2.7354%Gulfport 965 629 1,075 1,001 1,008 1,073 1,190 1,222 1,187 1,128 1,036 276 10,825 0.9275%Indian Rocks Beach 348 218 372 346 349 371 412 423 411 390 358 96 3,745 0.3209%Indian Shores 120 78 133 124 124 132 147 151 147 139 128 34 1,336 0.1145%Kenneth City 355 232 396 369 371 395 438 450 437 415 381 102 3,987 0.3416%Largo 5,447 3,557 6,082 5,666 5,706 6,069 6,733 6,912 6,715 6,382 5,859 1,563 61,244 5.2476%Madeira Beach 381 226 386 360 362 385 427 439 426 405 372 99 3,886 0.3330%N. Redington Beach 96 61 104 97 97 104 115 118 115 109 100 27 1,045 0.0895%Oldsmar 661 463 792 738 743 791 877 900 875 831 763 204 7,977 0.6835%Pinellas Park 3,564 2,347 4,012 3,738 3,764 4,004 4,441 4,560 4,430 4,210 3,865 1,031 40,400 3.4616%Redington Beach 137 86 148 138 139 147 164 168 163 155 142 38 1,488 0.1275%Redington Shores 208 128 219 204 206 219 243 249 242 230 211 56 2,208 0.1892%Safety Harbor 1,241 843 1,442 1,343 1,353 1,439 1,596 1,639 1,592 1,513 1,389 371 14,521 1.2442%St. Petersburg 19,925 500 854 796 801 852 946 971 943 896 823 219 8,601 0.7370%St. Petersburg Beach 795 12,816 21,910 20,412 20,555 21,866 24,256 24,903 24,191 22,992 21,107 5,630 220,638 18.9049%Seminole 732 502 858 800 805 857 950 976 948 901 827 221 8,643 0.7406%South Pasadena 477 311 532 496 499 531 589 605 588 559 513 137 5,362 0.4594%Tarpon Springs 1,516 1,002 1,713 1,596 1,607 1,710 1,897 1,947 1,892 1,798 1,651 440 17,254 1.4784%Treasure Island 602 391 668 623 627 667 740 760 738 701 644 172 6,729 0.5766%Municipalities Subtotal 49,396 32,043 54,781 51,036 51,393 54,671 60,648 62,264 60,486 57,488 52,773 14,077 551,661 47.2680%Total 111,813 73,124 124,562 115,972 116,727 123,662 136,307 139,726 135,964 129,621 119,646 31,781 1,247,093 100.0000%5.9% 10.2% 2.5% -2.7% -4.7% -7.7%Maximum Annual Debt Service 19,505 19,505 23,647 23,647 23,647 23,647 23,647 23,647 23,647 n/aDebt Service Coverage 3.13 2.92 2.42 2.68 2.80 2.92 3.05 3.19 3.33Notes:The above distribution of Local Infrastructure Sales Surtax is based on the following assumptions:1. The allocation of receipts toward Criminal Justice and related facilities is set for $80 Million for the 10 year extension period per the interlocal agreement.2. The distribution percentages to Pinellas County and the municipalities are determined by the interlocal agreement.3. The first column of Actuals for FY00 reflects the amounts collected and distributed for both the Original Penny and the Extended Penny.The second column of Actuals for FY00 (included in the Total column) only reflects the amount collected and distributed for the Extended Penny.4. FY01 distributions are for 13 months due to a change in accrual of revenue resulting from compliance with Governmental Accounting Standards Board Statement 33.If FY01 was prepared on the same basis as the prior years ('I.e., 12 months), the total distributed would be $114.208 million and Pinellas County's share $64.006 million.5. The revenue generated by a sales tax is extremely sensitive to economic conditions. The projection is based upon continuedeconomic growth in Pinellas County and is subject to changes in the national economy. Projections may be revised from time to time.6. Maximum Annual Debt Service includes Series 2000 Bonds FY01-FY10 and Series 2002 Bonds FY03-FY10.7. The FY10 Estimate for "Total Pinellas County" reflects the remaining 4 months from the Interlocal Agreement. The annual total is estimated at $70,790,130 which includes 8 months from the Third Extension of the Penny for Pinellaswhich has different distribution factors.Penny Distribution Formulas 1990 to 2020 Extended Penny 8/20/2010 4:40 PM