DRAFT
FY 2020 - PSTA
FY 2020 - PSTA
- No tags were found...

Create successful ePaper yourself
Turn your PDF publications into a flip-book with our unique Google optimized e-Paper software.
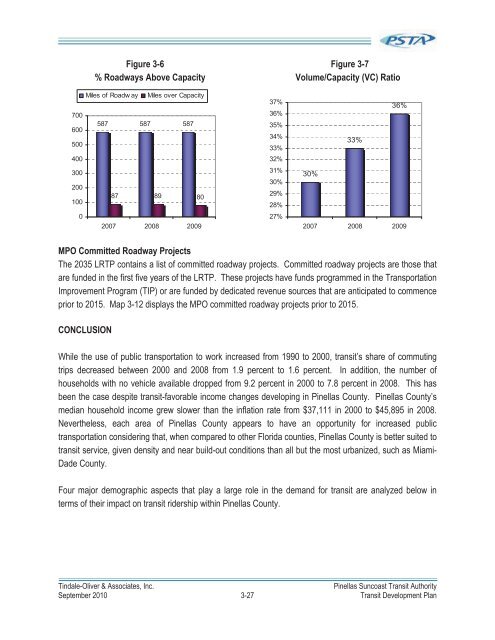
Figure 3-6 Figure 3-7% Roadways Above Capacity Volume/Capacity (VC) RatioMiles of Roadw ay Miles over Capacity700600587 587 58750040030020010087 89 8002007 2008 200937%36%35%34%33%32%31%30%29%28%27%36%33%30%2007 2008 2009MPO Committed Roadway ProjectsThe 2035 LRTP contains a list of committed roadway projects. Committed roadway projects are those thatare funded in the first five years of the LRTP. These projects have funds programmed in the TransportationImprovement Program (TIP) or are funded by dedicated revenue sources that are anticipated to commenceprior to 2015. Map 3-12 displays the MPO committed roadway projects prior to 2015.CONCLUSIONWhile the use of public transportation to work increased from 1990 to 2000, transit’s share of commutingtrips decreased between 2000 and 2008 from 1.9 percent to 1.6 percent. In addition, the number ofhouseholds with no vehicle available dropped from 9.2 percent in 2000 to 7.8 percent in 2008. This hasbeen the case despite transit-favorable income changes developing in Pinellas County. Pinellas County’smedian household income grew slower than the inflation rate from $37,111 in 2000 to $45,895 in 2008.Nevertheless, each area of Pinellas County appears to have an opportunity for increased publictransportation considering that, when compared to other Florida counties, Pinellas County is better suited totransit service, given density and near build-out conditions than all but the most urbanized, such as Miami-Dade County.Four major demographic aspects that play a large role in the demand for transit are analyzed below interms of their impact on transit ridership within Pinellas County.Tindale-Oliver & Associates, Inc.Pinellas Suncoast Transit AuthoritySeptember 2010 3-27 Transit Development Plan