DRAFT
FY 2020 - PSTA
FY 2020 - PSTA
- No tags were found...

You also want an ePaper? Increase the reach of your titles
YUMPU automatically turns print PDFs into web optimized ePapers that Google loves.
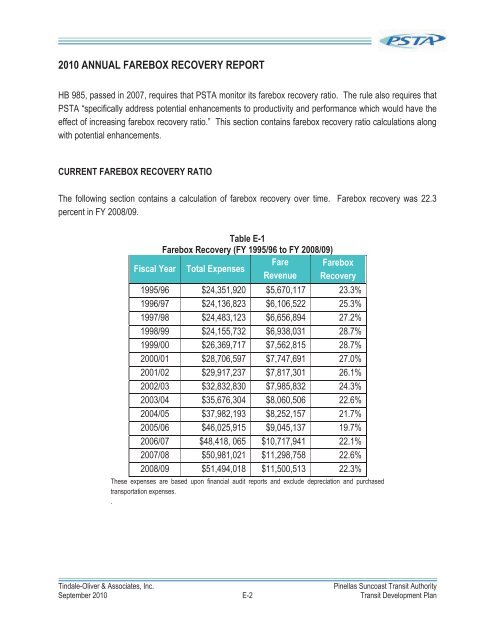
2010 ANNUAL FAREBOX RECOVERY REPORTHB 985, passed in 2007, requires that PSTA monitor its farebox recovery ratio. The rule also requires thatPSTA “specifically address potential enhancements to productivity and performance which would have theeffect of increasing farebox recovery ratio.” This section contains farebox recovery ratio calculations alongwith potential enhancements.CURRENT FAREBOX RECOVERY RATIOThe following section contains a calculation of farebox recovery over time. Farebox recovery was 22.3percent in FY 2008/09.Table E-1Farebox Recovery (FY 1995/96 to FY 2008/09)Fiscal Year Total ExpensesFare FareboxRevenue Recovery1995/96 $24,351,920 $5,670,117 23.3%1996/97 $24,136,823 $6,106,522 25.3%1997/98 $24,483,123 $6,656,894 27.2%1998/99 $24,155,732 $6,938,031 28.7%1999/00 $26,369,717 $7,562,815 28.7%2000/01 $28,706,597 $7,747,691 27.0%2001/02 $29,917,237 $7,817,301 26.1%2002/03 $32,832,830 $7,985,832 24.3%2003/04 $35,676,304 $8,060,506 22.6%2004/05 $37,982,193 $8,252,157 21.7%2005/06 $46,025,915 $9,045,137 19.7%2006/07 $48,418, 065 $10,717,941 22.1%2007/08 $50,981,021 $11,298,758 22.6%2008/09 $51,494,018 $11,500,513 22.3%These expenses are based upon financial audit reports and exclude depreciation and purchasedtransportation expenses..Tindale-Oliver & Associates, Inc.Pinellas Suncoast Transit AuthoritySeptember 2010 E-2 Transit Development Plan