DRAFT
FY 2020 - PSTA
FY 2020 - PSTA
- No tags were found...

Create successful ePaper yourself
Turn your PDF publications into a flip-book with our unique Google optimized e-Paper software.
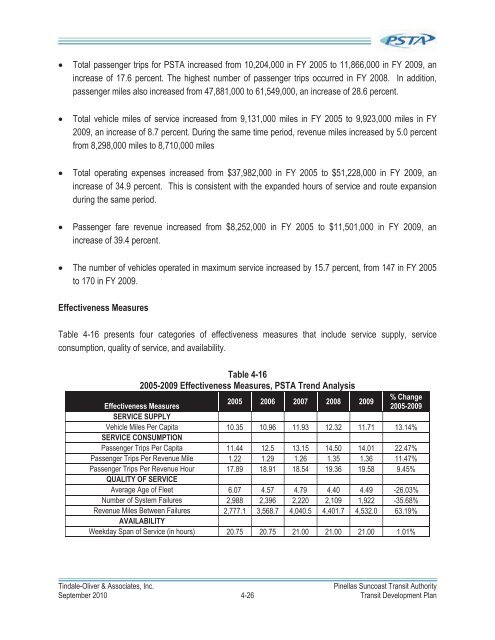
Total passenger trips for PSTA increased from 10,204,000 in FY 2005 to 11,866,000 in FY 2009, anincrease of 17.6 percent. The highest number of passenger trips occurred in FY 2008. In addition,passenger miles also increased from 47,881,000 to 61,549,000, an increase of 28.6 percent.Total vehicle miles of service increased from 9,131,000 miles in FY 2005 to 9,923,000 miles in FY2009, an increase of 8.7 percent. During the same time period, revenue miles increased by 5.0 percentfrom 8,298,000 miles to 8,710,000 milesTotal operating expenses increased from $37,982,000 in FY 2005 to $51,228,000 in FY 2009, anincrease of 34.9 percent. This is consistent with the expanded hours of service and route expansionduring the same period.Passenger fare revenue increased from $8,252,000 in FY 2005 to $11,501,000 in FY 2009, anincrease of 39.4 percent. The number of vehicles operated in maximum service increased by 15.7 percent, from 147 in FY 2005to 170 in FY 2009.Effectiveness MeasuresTable 4-16 presents four categories of effectiveness measures that include service supply, serviceconsumption, quality of service, and availability.Table 4-162005-2009 Effectiveness Measures, PSTA Trend Analysis% Change2005 2006 2007 2008 2009Effectiveness Measures2005-2009SERVICE SUPPLYVehicle Miles Per Capita 10.35 10.96 11.93 12.32 11.71 13.14%SERVICE CONSUMPTIONPassenger Trips Per Capita 11.44 12.5 13.15 14.50 14.01 22.47%Passenger Trips Per Revenue Mile 1.22 1.29 1.26 1.35 1.36 11.47%Passenger Trips Per Revenue Hour 17.89 18.91 18.54 19.36 19.58 9.45%QUALITY OF SERVICEAverage Age of Fleet 6.07 4.57 4.79 4.40 4.49 -26.03%Number of System Failures 2,988 2,396 2,220 2,109 1,922 -35.68%Revenue Miles Between Failures 2,777.1 3,568.7 4,040.5 4,401.7 4,532.0 63.19%AVAILABILITYWeekday Span of Service (in hours) 20.75 20.75 21.00 21.00 21.00 1.01%Tindale-Oliver & Associates, Inc.Pinellas Suncoast Transit AuthoritySeptember 2010 4-26 Transit Development Plan