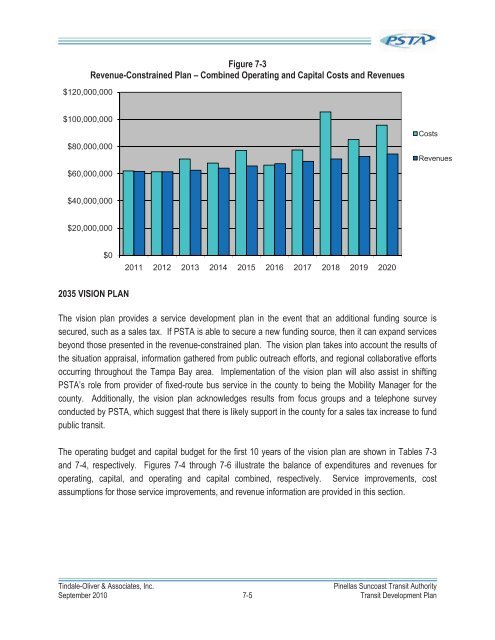
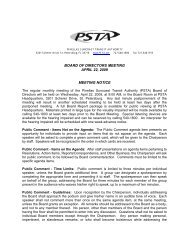
$120,000,000Figure 7-3Revenue-Constrained Plan – Combined Operating and Capital Costs and Revenues$100,000,000$80,000,000CostsRevenues$60,000,000$40,000,000$20,000,000$02011 2012 2013 2014 2015 2016 2017 2018 2019 20202035 VISION PLANThe vision plan provides a service development plan in the event that an additional funding source issecured, such as a sales tax. If PSTA is able to secure a new funding source, then it can expand servicesbeyond those presented in the revenue-constrained plan. The vision plan takes into account the results ofthe situation appraisal, information gathered from public outreach efforts, and regional collaborative effortsoccurring throughout the Tampa Bay area. Implementation of the vision plan will also assist in shiftingPSTA’s role from provider of fixed-route bus service in the county to being the Mobility Manager for thecounty. Additionally, the vision plan acknowledges results from focus groups and a telephone surveyconducted by PSTA, which suggest that there is likely support in the county for a sales tax increase to fundpublic transit.The operating budget and capital budget for the first 10 years of the vision plan are shown in Tables 7-3and 7-4, respectively. Figures 7-4 through 7-6 illustrate the balance of expenditures and revenues foroperating, capital, and operating and capital combined, respectively. Service improvements, costassumptions for those service improvements, and revenue information are provided in this section.Tindale-Oliver & Associates, Inc.Pinellas Suncoast Transit AuthoritySeptember 2010 7-5 Transit Development Plan
Table 7-3Vision Plan – Operating Budget (FY 2010/11 – FY 2019/20)Fixed Route Bus 2011 2012 2013 2014 2015 2016 2017 2018 2019 2020 10-Year TotalOperating CostsExisting Service $50,243,237 $51,248,101 $37,526,361 $0 $0 $0 $0 $0 $0 $0 $139,017,698New Service $0 $0 $28,507,504 $85,957,417 $91,262,517 $96,745,439 $102,411,172 $108,264,836 $114,311,682 $116,597,916 $744,058,482Total Costs $50,243,237 $51,248,101 $66,033,865 $85,957,417 $91,262,517 $96,745,439 $102,411,172 $108,264,836 $114,311,682 $116,597,916 $883,076,180Operating RevenuesExisting SourcesFare Revenue - Existing $11,555,944 $11,787,063 $8,631,063 $0 $0 $0 $0 $0 $0 $0 $31,974,071Auxiliary Revenue $184,800 $203,280 $223,608 $228,080 $232,642 $237,295 $242,040 $246,881 $251,819 $256,855 $2,307,301Non-Transportation Revenue $664,880 $624,203 $508,738 $518,913 $529,291 $539,877 $550,674 $561,688 $572,922 $584,380 $5,655,566Property Tax $26,425,140 $0 $0 $0 $0 $0 $0 $0 $0 $0 $26,425,140State Reimbursement - Fuel Tax $535,970 $535,970 $535,970 $546,689 $557,623 $568,776 $580,151 $591,754 $603,589 $615,661 $5,672,154State Grants $3,988,391 $4,068,159 $4,149,522 $4,232,512 $4,317,163 $4,403,506 $4,491,576 $4,581,408 $4,673,036 $4,766,496 $43,671,769Pass-Thru Grant $80,000 $80,000 $80,000 $81,600 $83,232 $84,897 $86,595 $88,326 $90,093 $91,895 $846,638Section 5307 & Other Federal Grants $7,043,517 $7,407,335 $7,789,809 $8,179,299 $8,588,264 $9,017,677 $9,468,561 $9,941,989 $10,439,089 $10,961,043 $88,836,582New SourcesSales Tax for Bus $0 $31,957,626 $5,381,196 $38,676,849 $45,283,590 $66,311,240 $58,288,575 $8,499,697 $66,436,731 $24,638,741 $345,474,245Fare Revenue - New $0 $0 $6,556,726 $19,770,206 $20,990,379 $22,251,451 $23,554,569 $24,900,912 $26,291,687 $26,817,521 $171,133,451Bond Issues $0 $0 $99,000,000 $0 $0 $0 $0 $142,065,000 $0 $0 $241,065,000Debt Service $0 $0 -$6,470,679 -$6,470,679 -$6,470,679 -$6,470,679 -$6,470,679 -$15,756,104 -$15,756,104 -$15,756,104 -$79,621,707Total Revenues $50,478,642 $56,663,636 $126,385,952 $65,763,470 $74,111,505 $96,944,038 $90,792,063 $175,721,552 $93,602,861 $52,976,488 $883,440,208Revenues Minus Costs $235,406 $5,415,535 $60,352,088 ($20,193,947) ($17,151,012) $198,600 ($11,619,108) $67,456,716 ($20,708,821) ($63,621,427) $364,028Rollover from Prev. Year $0 $235,406 $5,650,940 $66,003,028 $45,809,081 $28,658,069 $28,856,669 $17,237,561 $84,694,276 $63,985,455 $364,028Surplus/Shortfall $235,406 $5,650,940 $66,003,028 $45,809,081 $28,658,069 $28,856,669 $17,237,561 $84,694,276 $63,985,455 $364,028 $364,028Tindale-Oliver & Associates, Inc. Pinellas Suncoast Transit AuthoritySeptember 2010 7-6 Transit Development Plan