DRAFT
FY 2020 - PSTA
FY 2020 - PSTA
- No tags were found...

You also want an ePaper? Increase the reach of your titles
YUMPU automatically turns print PDFs into web optimized ePapers that Google loves.
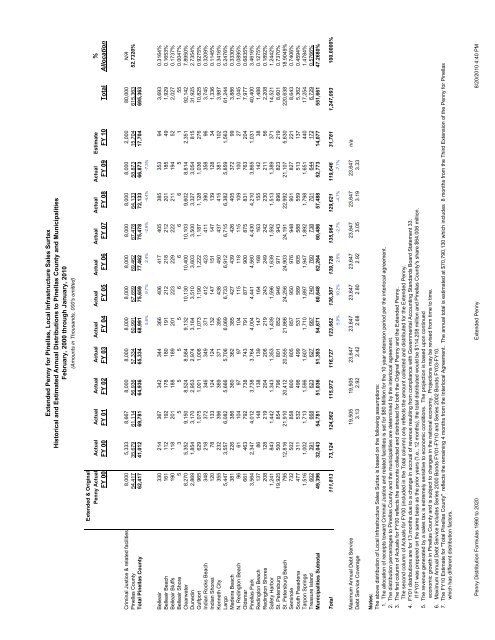
Extended Penny for Pinellas, Local Infrastructure Sales SurtaxHistorical and Estimated Annual Distributions to Pinellas County and MunicipalitiesFebruary, 2000 through January, 2010(Amounts in Thousands, 000's omitted)Extended & OriginalPenny Actual Actual Actual Actual Actual Actual Actual Actual Actual Actual Actual Estimate %FY 00 FY 00 FY 01 FY 02 FY 03 FY 04 FY 05 FY 06 FY 07 FY 08 FY 09 FY 10 Total AllocationCriminal Justice & related facilities 8,000 5,333 8,667 8,000 8,000 8,000 8,000 8,000 8,000 8,000 8,000 2,000 80,000 N/APinellas County 54,417 35,679 61,114 56,936 57,334 60,991 67,659 69,462 67,478 64,133 58,873 15,704 615,363 52.7320%Total Pinellas County 62,417 41,012 69,781 64,936 65,334 68,991 75,659 77,462 75,478 72,133 66,873 17,704 695,3635.6% 9.7% 2.4% -2.6% -4.4% -7.3%Belleair 330 214 367 342 344 366 406 417 405 385 353 94 3,693 0.3164%Belleair Beach 161 112 192 178 180 191 212 218 212 201 185 49 1,929 0.1653%Belleair Bluffs 190 118 201 188 189 201 223 229 222 211 194 52 2,027 0.1737%Belleair Shore 5 3 5 5 5 5 6 6 6 6 5 1 55 0.0047%Clearwater 8,270 5,352 9,150 8,524 8,584 9,132 10,130 10,400 10,103 9,602 8,814 2,351 92,142 7.8950%Dunedin 2,869 1,854 3,170 2,953 2,974 3,164 3,510 3,603 3,500 3,327 3,054 815 31,925 2.7354%Gulfport 965 629 1,075 1,001 1,008 1,073 1,190 1,222 1,187 1,128 1,036 276 10,825 0.9275%Indian Rocks Beach 348 218 372 346 349 371 412 423 411 390 358 96 3,745 0.3209%Indian Shores 120 78 133 124 124 132 147 151 147 139 128 34 1,336 0.1145%Kenneth City 355 232 396 369 371 395 438 450 437 415 381 102 3,987 0.3416%Largo 5,447 3,557 6,082 5,666 5,706 6,069 6,733 6,912 6,715 6,382 5,859 1,563 61,244 5.2476%Madeira Beach 381 226 386 360 362 385 427 439 426 405 372 99 3,886 0.3330%N. Redington Beach 96 61 104 97 97 104 115 118 115 109 100 27 1,045 0.0895%Oldsmar 661 463 792 738 743 791 877 900 875 831 763 204 7,977 0.6835%Pinellas Park 3,564 2,347 4,012 3,738 3,764 4,004 4,441 4,560 4,430 4,210 3,865 1,031 40,400 3.4616%Redington Beach 137 86 148 138 139 147 164 168 163 155 142 38 1,488 0.1275%Redington Shores 208 128 219 204 206 219 243 249 242 230 211 56 2,208 0.1892%Safety Harbor 1,241 843 1,442 1,343 1,353 1,439 1,596 1,639 1,592 1,513 1,389 371 14,521 1.2442%St. Petersburg 19,925 500 854 796 801 852 946 971 943 896 823 219 8,601 0.7370%St. Petersburg Beach 795 12,816 21,910 20,412 20,555 21,866 24,256 24,903 24,191 22,992 21,107 5,630 220,638 18.9049%Seminole 732 502 858 800 805 857 950 976 948 901 827 221 8,643 0.7406%South Pasadena 477 311 532 496 499 531 589 605 588 559 513 137 5,362 0.4594%Tarpon Springs 1,516 1,002 1,713 1,596 1,607 1,710 1,897 1,947 1,892 1,798 1,651 440 17,254 1.4784%Treasure Island 602 391 668 623 627 667 740 760 738 701 644 172 6,729 0.5766%Municipalities Subtotal 49,396 32,043 54,781 51,036 51,393 54,671 60,648 62,264 60,486 57,488 52,773 14,077 551,661 47.2680%Total 111,813 73,124 124,562 115,972 116,727 123,662 136,307 139,726 135,964 129,621 119,646 31,781 1,247,093 100.0000%5.9% 10.2% 2.5% -2.7% -4.7% -7.7%Maximum Annual Debt Service 19,505 19,505 23,647 23,647 23,647 23,647 23,647 23,647 23,647 n/aDebt Service Coverage 3.13 2.92 2.42 2.68 2.80 2.92 3.05 3.19 3.33Notes:The above distribution of Local Infrastructure Sales Surtax is based on the following assumptions:1. The allocation of receipts toward Criminal Justice and related facilities is set for $80 Million for the 10 year extension period per the interlocal agreement.2. The distribution percentages to Pinellas County and the municipalities are determined by the interlocal agreement.3. The first column of Actuals for FY00 reflects the amounts collected and distributed for both the Original Penny and the Extended Penny.The second column of Actuals for FY00 (included in the Total column) only reflects the amount collected and distributed for the Extended Penny.4. FY01 distributions are for 13 months due to a change in accrual of revenue resulting from compliance with Governmental Accounting Standards Board Statement 33.If FY01 was prepared on the same basis as the prior years ('I.e., 12 months), the total distributed would be $114.208 million and Pinellas County's share $64.006 million.5. The revenue generated by a sales tax is extremely sensitive to economic conditions. The projection is based upon continuedeconomic growth in Pinellas County and is subject to changes in the national economy. Projections may be revised from time to time.6. Maximum Annual Debt Service includes Series 2000 Bonds FY01-FY10 and Series 2002 Bonds FY03-FY10.7. The FY10 Estimate for "Total Pinellas County" reflects the remaining 4 months from the Interlocal Agreement. The annual total is estimated at $70,790,130 which includes 8 months from the Third Extension of the Penny for Pinellaswhich has different distribution factors.Penny Distribution Formulas 1990 to 2020 Extended Penny 8/20/2010 4:40 PM