DRAFT
FY 2020 - PSTA
FY 2020 - PSTA
- No tags were found...

Create successful ePaper yourself
Turn your PDF publications into a flip-book with our unique Google optimized e-Paper software.
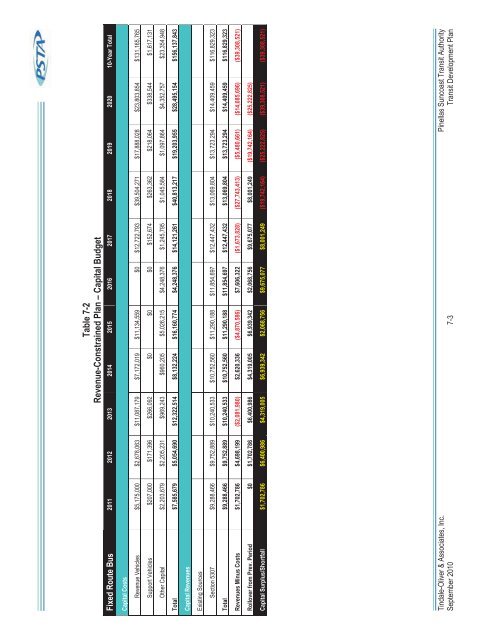
Table 7-2Revenue-Constrained Plan – Capital BudgetFixed Route Bus 2011 2012 2013 2014 2015 2016 2017 2018 2019 2020 10-Year TotalCapital CostsRevenue Vehicles $5,175,000 $2,678,063 $11,087,179 $7,172,019 $11,134,559 $0 $12,722,793 $39,504,271 $17,888,028 $23,803,854 $131,165,765Support Vehicles $207,000 $171,396 $266,092 $0 $0 $0 $152,674 $263,362 $218,064 $338,544 $1,617,131Other Capital $2,203,679 $2,205,231 $969,243 $960,205 $5,026,215 $4,248,376 $1,245,795 $1,045,584 $1,097,864 $4,352,757 $23,354,948Total $7,585,679 $5,054,690 $12,322,514 $8,132,224 $16,160,774 $4,248,376 $14,121,261 $40,813,217 $19,203,955 $28,495,154 $156,137,843Capital RevenuesExisting SourcesSection 5307 $9,288,466 $9,752,889 $10,240,533 $10,752,560 $11,290,188 $11,854,697 $12,447,432 $13,069,804 $13,723,294 $14,409,459 $116,829,323Total $9,288,466 $9,752,889 $10,240,533 $10,752,560 $11,290,188 $11,854,697 $12,447,432 $13,069,804 $13,723,294 $14,409,459 $116,829,323Revenues Minus Costs $1,702,786 $4,698,199 ($2,081,980) $2,620,336 ($4,870,586) $7,606,322 ($1,673,828) ($27,743,413) ($5,480,661) ($14,085,696) ($39,308,521)Rollover from Prev. Period $0 $1,702,786 $6,400,986 $4,319,005 $6,939,342 $2,068,756 $9,675,077 $8,001,249 ($19,742,164) ($25,222,825)Capital Surplus/Shortfall $1,702,786 $6,400,986 $4,319,005 $6,939,342 $2,068,756 $9,675,077 $8,001,249 ($19,742,164) ($25,222,825) ($39,308,521) ($39,308,521)Tindale-Oliver & Associates, Inc. Pinellas Suncoast Transit AuthoritySeptember 2010 7-3 Transit Development Plan