DRAFT
FY 2020 - PSTA
FY 2020 - PSTA
- No tags were found...

Create successful ePaper yourself
Turn your PDF publications into a flip-book with our unique Google optimized e-Paper software.
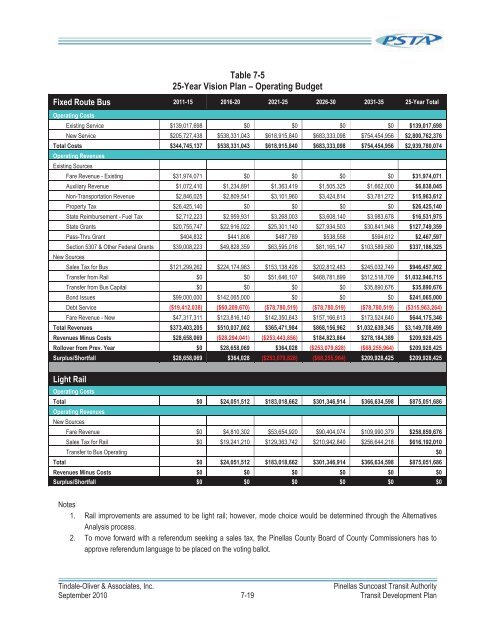
Table 7-525-Year Vision Plan – Operating BudgetFixed Route Bus 2011-15 2016-20 2021-25 2026-30 2031-35 25-Year TotalOperating CostsExisting Service $139,017,698 $0 $0 $0 $0 $139,017,698New Service $205,727,438 $538,331,043 $618,915,840 $683,333,098 $754,454,956 $2,800,762,376Total Costs $344,745,137 $538,331,043 $618,915,840 $683,333,098 $754,454,956 $2,939,780,074Operating RevenuesExisting SourcesFare Revenue - Existing $31,974,071 $0 $0 $0 $0 $31,974,071Auxiliary Revenue $1,072,410 $1,234,891 $1,363,419 $1,505,325 $1,662,000 $6,838,045Non-Transportation Revenue $2,846,025 $2,809,541 $3,101,960 $3,424,814 $3,781,272 $15,963,612Property Tax $26,425,140 $0 $0 $0 $0 $26,425,140State Reimbursement - Fuel Tax $2,712,223 $2,959,931 $3,268,003 $3,608,140 $3,983,678 $16,531,975State Grants $20,755,747 $22,916,022 $25,301,140 $27,934,503 $30,841,948 $127,749,359Pass-Thru Grant $404,832 $441,806 $487,789 $538,558 $594,612 $2,467,597Section 5307 & Other Federal Grants $39,008,223 $49,828,359 $63,595,016 $81,165,147 $103,589,580 $337,186,325New SourcesSales Tax for Bus $121,299,262 $224,174,983 $153,138,426 $202,812,483 $245,032,749 $946,457,902Transfer from Rail $0 $0 $51,646,107 $468,781,899 $512,518,709 $1,032,946,715Transfer from Bus Capital $0 $0 $0 $0 $35,890,676 $35,890,676Bond Issues $99,000,000 $142,065,000 $0 $0 $0 $241,065,000Debt Service ($19,412,038) ($60,209,670) ($78,780,519) ($78,780,519) ($78,780,519) ($315,963,264)Fare Revenue - New $47,317,311 $123,816,140 $142,350,643 $157,166,613 $173,524,640 $644,175,346Total Revenues $373,403,205 $510,037,002 $365,471,984 $868,156,962 $1,032,639,345 $3,149,708,499Revenues Minus Costs $28,658,069 ($28,294,041) ($253,443,856) $184,823,864 $278,184,389 $209,928,425Rollover from Prev. Year $0 $28,658,069 $364,028 ($253,079,828) ($68,255,964) $209,928,425Surplus/Shortfall $28,658,069 $364,028 ($253,079,828) ($68,255,964) $209,928,425 $209,928,425Light RailOperating CostsTotal $0 $24,051,512 $183,018,662 $301,346,914 $366,634,598 $875,051,686Operating RevenuesNew SourcesFare Revenue $0 $4,810,302 $53,654,920 $90,404,074 $109,990,379 $258,859,676Sales Tax for Rail $0 $19,241,210 $129,363,742 $210,942,840 $256,644,218 $616,192,010Transfer to Bus Operating $0Total $0 $24,051,512 $183,018,662 $301,346,914 $366,634,598 $875,051,686Revenues Minus Costs $0 $0 $0 $0 $0 $0Surplus/Shortfall $0 $0 $0 $0 $0 $0Notes1. Rail improvements are assumed to be light rail; however, mode choice would be determined through the AlternativesAnalysis process.2. To move forward with a referendum seeking a sales tax, the Pinellas County Board of County Commissioners has toapprove referendum language to be placed on the voting ballot.Tindale-Oliver & Associates, Inc.Pinellas Suncoast Transit AuthoritySeptember 2010 7-19 Transit Development Plan