DRAFT
FY 2020 - PSTA
FY 2020 - PSTA
- No tags were found...

You also want an ePaper? Increase the reach of your titles
YUMPU automatically turns print PDFs into web optimized ePapers that Google loves.
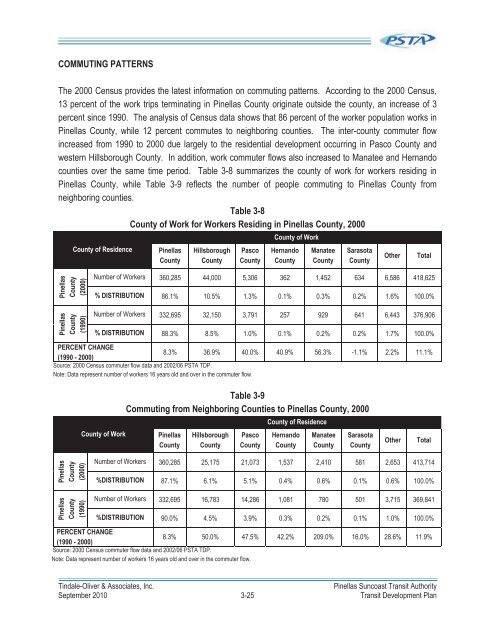
COMMUTING PATTERNSThe 2000 Census provides the latest information on commuting patterns. According to the 2000 Census,13 percent of the work trips terminating in Pinellas County originate outside the county, an increase of 3percent since 1990. The analysis of Census data shows that 86 percent of the worker population works inPinellas County, while 12 percent commutes to neighboring counties. The inter-county commuter flowincreased from 1990 to 2000 due largely to the residential development occurring in Pasco County andwestern Hillsborough County. In addition, work commuter flows also increased to Manatee and Hernandocounties over the same time period. Table 3-8 summarizes the county of work for workers residing inPinellas County, while Table 3-9 reflects the number of people commuting to Pinellas County fromneighboring counties.Table 3-8County of Work for Workers Residing in Pinellas County, 2000County of ResidencePinellasCountyHillsboroughCountyPascoCountyCounty of WorkHernandoCountyManateeCountySarasotaCountyOtherTotalPinellasCounty(2000)PinellasCounty(1990)Number of Workers 360,285 44,000 5,306 362 1,452 634 6,586 418,625% DISTRIBUTION 86.1% 10.5% 1.3% 0.1% 0.3% 0.2% 1.6% 100.0%Number of Workers 332,695 32,150 3,791 257 929 641 6,443 376,906% DISTRIBUTION 88.3% 8.5% 1.0% 0.1% 0.2% 0.2% 1.7% 100.0%PERCENT CHANGE8.3% 36.9% 40.0% 40.9% 56.3% -1.1% 2.2% 11.1%(1990 - 2000)Source: 2000 Census commuter flow data and 2002/06 PSTA TDP.Note: Data represent number of workers 16 years old and over in the commuter flow.County of WorkTable 3-9Commuting from Neighboring Counties to Pinellas County, 2000PinellasCountyHillsboroughCountyPascoCountyCounty of ResidenceHernandoCountyManateeCountySarasotaCountyOtherTotalPinellasCounty(2000)PinellasCounty(1990)Number of Workers 360,285 25,175 21,073 1,537 2,410 581 2,653 413,714%DISTRIBUTION 87.1% 6.1% 5.1% 0.4% 0.6% 0.1% 0.6% 100.0%Number of Workers 332,695 16,783 14,286 1,081 780 501 3,715 369,841%DISTRIBUTION 90.0% 4.5% 3.9% 0.3% 0.2% 0.1% 1.0% 100.0%PERCENT CHANGE8.3% 50.0% 47.5% 42.2% 209.0% 16.0% 28.6% 11.9%(1990 - 2000)Source: 2000 Census commuter flow data and 2002/06 PSTA TDP.Note: Data represent number of workers 16 years old and over in the commuter flow.Tindale-Oliver & Associates, Inc.Pinellas Suncoast Transit AuthoritySeptember 2010 3-25 Transit Development Plan