DRAFT
FY 2020 - PSTA
FY 2020 - PSTA
- No tags were found...

Create successful ePaper yourself
Turn your PDF publications into a flip-book with our unique Google optimized e-Paper software.
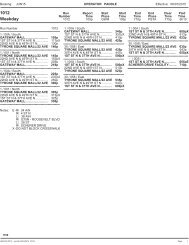
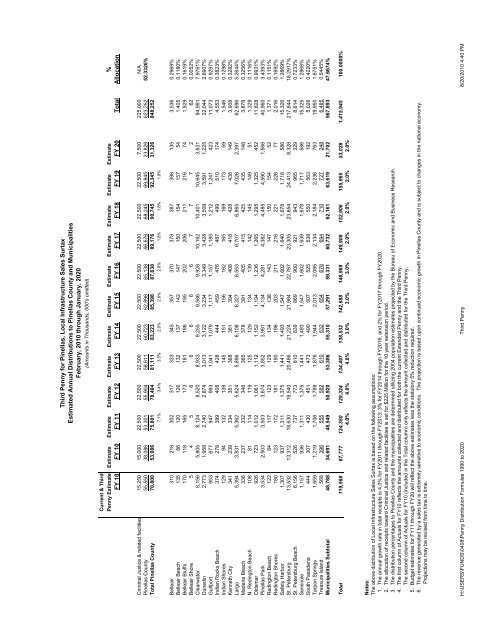
Third Penny for Pinellas, Local Infrastructure Sales SurtaxEstimated Annual Distributions to Pinellas County and MunicipalitiesFebruary, 2010 through January, 2020(Amounts in Thousands, 000's omitted)Current & ThirdPenny Estimate Estimate Estimate Estimate Estimate Estimate Estimate Estimate Estimate Estimate Estimate Estimate %FY 10 FY 10 FY 11 FY 12 FY 13 FY 14 FY 15 FY 16 FY 17 FY 18 FY 19 FY 20 Total AllocationCriminal Justice & related facilities 15,250 15,000 22,500 22,500 22,500 22,500 22,500 22,500 22,500 22,500 22,500 7,500 225,000 N/APinellas County 55,550 38,086 53,301 55,904 58,611 60,723 62,898 65,138 66,676 68,245 69,845 23,826 623,252 52.3326%Total Pinellas County 70,800 53,086 75,801 78,404 81,111 83,223 85,398 87,638 89,176 90,745 92,345 31,326 848,2527.1% 3.4% 3.5% 2.6% 2.6% 2.6% 1.8% 1.8% 1.8%Belleair 310 216 302 317 333 345 357 370 378 387 396 135 3,536 0.2969%Belleair Beach 135 86 120 126 132 137 142 147 150 154 157 54 1,405 0.1180%Belleair Bluffs 170 118 165 173 181 188 195 202 206 211 216 74 1,929 0.1619%Belleair Shore 5 4 5 6 6 6 6 6 7 7 7 2 62 0.0052%Clearwater 8,156 5,805 8,124 8,520 8,933 9,255 9,586 9,928 10,162 10,401 10,645 3,631 94,991 7.9761%Dunedin 2,773 1,958 2,740 2,874 3,013 3,122 3,234 3,349 3,428 3,509 3,591 1,225 32,044 2.6907%Gulfport 953 677 947 993 1,041 1,079 1,117 1,157 1,185 1,212 1,241 423 11,073 0.9297%Indian Rocks Beach 374 278 389 408 428 444 459 476 487 499 510 174 4,553 0.3823%Indian Shores 129 94 132 139 145 151 156 162 165 169 173 59 1,546 0.1298%Kenneth City 341 239 334 351 368 381 394 408 418 428 438 149 3,908 0.3282%Largo 5,394 3,831 5,362 5,624 5,896 6,108 6,327 6,553 6,707 6,865 7,026 2,397 62,696 5.2644%Madeira Beach 336 237 332 348 365 378 391 405 415 425 435 148 3,878 0.3256%N. Redington Beach 108 81 114 119 125 129 134 139 142 145 149 51 1,329 0.1116%Oldsmar 926 723 1,012 1,061 1,112 1,152 1,194 1,236 1,265 1,295 1,325 452 11,828 0.9931%Pinellas Park 3,534 2,503 3,503 3,674 3,852 3,991 4,134 4,281 4,382 4,485 4,590 1,566 40,960 3.4393%Redington Beach 122 84 117 123 129 134 138 143 147 150 154 52 1,371 0.1151%Redington Shores 180 123 172 181 190 196 203 211 216 221 226 77 2,016 0.1692%Safety Harbor 1,307 937 1,311 1,375 1,441 1,493 1,547 1,602 1,640 1,678 1,718 586 15,326 1.2869%St. Petersburg 13,532 13,312 18,630 19,540 20,486 21,224 21,984 22,767 23,305 23,854 24,413 8,328 217,844 18.2917%St. Petersburg Beach 6,156 526 737 773 810 839 869 900 921 943 965 329 8,614 0.7233%Seminole 1,157 936 1,311 1,375 1,441 1,493 1,547 1,602 1,639 1,678 1,717 586 15,325 1.2868%South Pasadena 444 307 430 451 473 490 507 525 538 550 563 192 5,026 0.4220%Tarpon Springs 1,659 1,219 1,706 1,789 1,876 1,944 2,013 2,085 2,134 2,184 2,236 763 19,950 1.6751%Treasure Island 568 396 555 582 610 632 654 678 694 710 727 248 6,485 0.5445%Municipalities Subtotal 48,768 34,691 48,549 50,920 53,386 55,310 57,291 59,331 60,732 62,161 63,619 21,702 567,693 47.6674%Total 119,568 87,777 124,350 129,324 134,497 138,532 142,688 146,969 149,908 152,906 155,965 53,028 1,415,945 100.0000%4.0% 4.0% 4.0% 3.0% 3.0% 3.0% 2.0% 2.0% 2.0% 2.0%Notes:The above distribution of Local Infrastructure Sales Surtax is based on the following assumptions:1. The annual growth rate in total receipts is 4.0% for FY2011 through FY2013; 3% for FY2014 through FY2016; and 2% for FY2017 through FY2020.2. The allocation of receipts toward Criminal Justice and related facilities is set for $225 Million for the 10 year extension period.3. The distribution percentages to Pinellas County and the municipalities are determined utilizing 2004 population estimates projected by the Bureau of Economic and Business Research.4. The first column of Actuals for FY10 reflects the amounts collected and distributed for both the current Extended Penny and the Third Penny.The second column of Actuals for FY10 (included in the Total column) only reflects the amount collected and distributed for the Third Penny.5. Budget estimates for FY11 through FY20 will reflect the above estimates less the statutory 5% reduction required.6. The revenue generated by a sales tax is extremely sensitive to economic conditions. The projection is based upon continued economic growth in Pinellas County and is subject to changes in the national economy.Projections may be revised from time to time.H:\USERS\FUNDS\0408\Penny Distribution Formulas 1990 to 2020 Third Penny 8/20/2010 4:40 PM