DRAFT
FY 2020 - PSTA
FY 2020 - PSTA
- No tags were found...

Create successful ePaper yourself
Turn your PDF publications into a flip-book with our unique Google optimized e-Paper software.
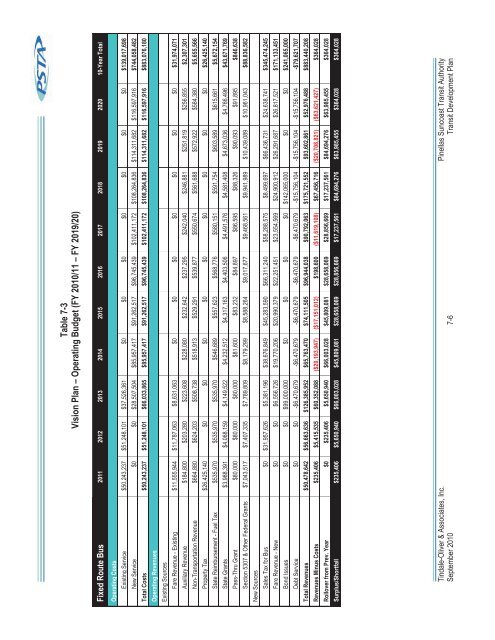
Table 7-3Vision Plan – Operating Budget (FY 2010/11 – FY 2019/20)Fixed Route Bus 2011 2012 2013 2014 2015 2016 2017 2018 2019 2020 10-Year TotalOperating CostsExisting Service $50,243,237 $51,248,101 $37,526,361 $0 $0 $0 $0 $0 $0 $0 $139,017,698New Service $0 $0 $28,507,504 $85,957,417 $91,262,517 $96,745,439 $102,411,172 $108,264,836 $114,311,682 $116,597,916 $744,058,482Total Costs $50,243,237 $51,248,101 $66,033,865 $85,957,417 $91,262,517 $96,745,439 $102,411,172 $108,264,836 $114,311,682 $116,597,916 $883,076,180Operating RevenuesExisting SourcesFare Revenue - Existing $11,555,944 $11,787,063 $8,631,063 $0 $0 $0 $0 $0 $0 $0 $31,974,071Auxiliary Revenue $184,800 $203,280 $223,608 $228,080 $232,642 $237,295 $242,040 $246,881 $251,819 $256,855 $2,307,301Non-Transportation Revenue $664,880 $624,203 $508,738 $518,913 $529,291 $539,877 $550,674 $561,688 $572,922 $584,380 $5,655,566Property Tax $26,425,140 $0 $0 $0 $0 $0 $0 $0 $0 $0 $26,425,140State Reimbursement - Fuel Tax $535,970 $535,970 $535,970 $546,689 $557,623 $568,776 $580,151 $591,754 $603,589 $615,661 $5,672,154State Grants $3,988,391 $4,068,159 $4,149,522 $4,232,512 $4,317,163 $4,403,506 $4,491,576 $4,581,408 $4,673,036 $4,766,496 $43,671,769Pass-Thru Grant $80,000 $80,000 $80,000 $81,600 $83,232 $84,897 $86,595 $88,326 $90,093 $91,895 $846,638Section 5307 & Other Federal Grants $7,043,517 $7,407,335 $7,789,809 $8,179,299 $8,588,264 $9,017,677 $9,468,561 $9,941,989 $10,439,089 $10,961,043 $88,836,582New SourcesSales Tax for Bus $0 $31,957,626 $5,381,196 $38,676,849 $45,283,590 $66,311,240 $58,288,575 $8,499,697 $66,436,731 $24,638,741 $345,474,245Fare Revenue - New $0 $0 $6,556,726 $19,770,206 $20,990,379 $22,251,451 $23,554,569 $24,900,912 $26,291,687 $26,817,521 $171,133,451Bond Issues $0 $0 $99,000,000 $0 $0 $0 $0 $142,065,000 $0 $0 $241,065,000Debt Service $0 $0 -$6,470,679 -$6,470,679 -$6,470,679 -$6,470,679 -$6,470,679 -$15,756,104 -$15,756,104 -$15,756,104 -$79,621,707Total Revenues $50,478,642 $56,663,636 $126,385,952 $65,763,470 $74,111,505 $96,944,038 $90,792,063 $175,721,552 $93,602,861 $52,976,488 $883,440,208Revenues Minus Costs $235,406 $5,415,535 $60,352,088 ($20,193,947) ($17,151,012) $198,600 ($11,619,108) $67,456,716 ($20,708,821) ($63,621,427) $364,028Rollover from Prev. Year $0 $235,406 $5,650,940 $66,003,028 $45,809,081 $28,658,069 $28,856,669 $17,237,561 $84,694,276 $63,985,455 $364,028Surplus/Shortfall $235,406 $5,650,940 $66,003,028 $45,809,081 $28,658,069 $28,856,669 $17,237,561 $84,694,276 $63,985,455 $364,028 $364,028Tindale-Oliver & Associates, Inc. Pinellas Suncoast Transit AuthoritySeptember 2010 7-6 Transit Development Plan