DRAFT
FY 2020 - PSTA
FY 2020 - PSTA
- No tags were found...

Create successful ePaper yourself
Turn your PDF publications into a flip-book with our unique Google optimized e-Paper software.
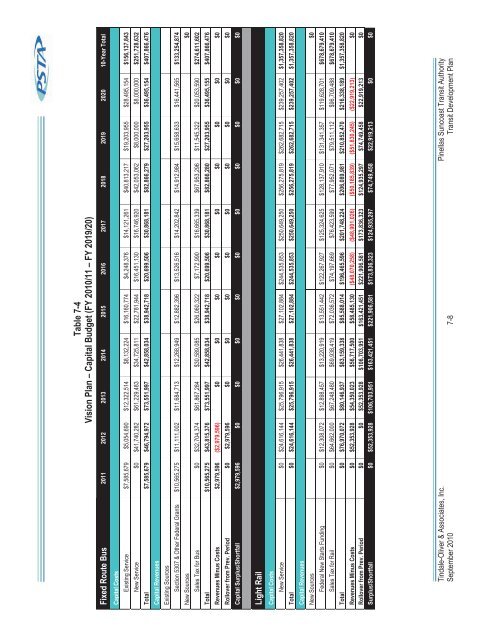
Table 7-4Vision Plan – Capital Budget (FY 2010/11 – FY 2019/20)Fixed Route Bus 2011 2012 2013 2014 2015 2016 2017 2018 2019 2020 10-Year TotalCapital CostsExisting Service $7,585,679 $5,054,690 $12,322,514 $8,132,224 $16,160,774 $4,248,376 $14,121,261 $40,813,217 $19,203,955 $28,495,154 $156,137,843New Service $0 $41,740,282 $61,229,483 $34,725,811 $22,781,944 $16,451,130 $16,746,920 $42,053,062 $8,000,000 $8,000,000 $251,728,632Total $7,585,679 $46,794,972 $73,551,997 $42,858,034 $38,942,718 $20,699,506 $30,868,181 $82,866,279 $27,203,955 $36,495,154 $407,866,476Capital RevenuesExisting SourcesSection 5307 & Other Federal Grants $10,565,275 $11,111,002 $11,684,713 $12,268,949 $12,882,396 $13,526,516 $14,202,842 $14,912,984 $15,658,633 $16,441,565 $133,254,874New Sources $0Sales Tax for Bus $0 $32,704,374 $61,867,284 $30,589,085 $26,060,322 $7,172,990 $16,665,339 $67,953,296 $11,545,322 $20,053,590 $274,611,602Total $10,565,275 $43,815,376 $73,551,997 $42,858,034 $38,942,718 $20,699,506 $30,868,181 $82,866,280 $27,203,955 $36,495,155 $407,866,476Revenues Minus Costs $2,979,596 ($2,979,596) $0 $0 $0 $0 $0 $0 $0 $0 $0Rollover from Prev. Period $0 $2,979,596 $0 $0 $0 $0 $0 $0 $0 $0 $0Capital Surplus/Shortfall $2,979,596 $0 $0 $0 $0 $0 $0 $0 $0 $0 $0Light RailCapital CostsNew Service $0 $24,616,144 $25,796,915 $26,441,838 $27,102,884 $244,535,853 $250,649,250 $256,275,819 $262,682,715 $239,257,402 $1,357,358,820Total $0 $24,616,144 $25,796,915 $26,441,838 $27,102,884 $244,535,853 $250,649,250 $256,275,819 $262,682,715 $239,257,402 $1,357,358,820Capital RevenuesNew Sources $0Federal New Starts Funding $0 $12,308,072 $12,898,457 $13,220,919 $13,551,442 $122,267,927 $125,324,625 $128,137,910 $131,341,357 $119,628,701 $678,679,410Sales Tax for Rail $0 $64,662,000 $67,248,480 $69,938,419 $72,036,572 $74,197,669 $76,423,599 $77,952,071 $79,511,112 $96,709,488 $678,679,410Total $0 $76,970,072 $80,146,937 $83,159,338 $85,588,014 $196,465,596 $201,748,224 $206,089,981 $210,852,470 $216,338,189 $1,357,358,820Revenues Minus Costs $0 $52,353,928 $54,350,023 $56,717,500 $58,485,130 ($48,070,258) ($48,901,026) ($50,185,839) ($51,830,245) ($22,919,213) $0Rollover from Prev. Period $0 $0 $52,353,928 $106,703,951 $163,421,451 $221,906,581 $173,836,323 $124,935,297 $74,749,458 $22,919,213 $0Surplus/Shortfall $0 $52,353,928 $106,703,951 $163,421,451 $221,906,581 $173,836,323 $124,935,297 $74,749,458 $22,919,213 $0 $0Tindale-Oliver & Associates, Inc. Pinellas Suncoast Transit AuthoritySeptember 2010 7-8 Transit Development Plan