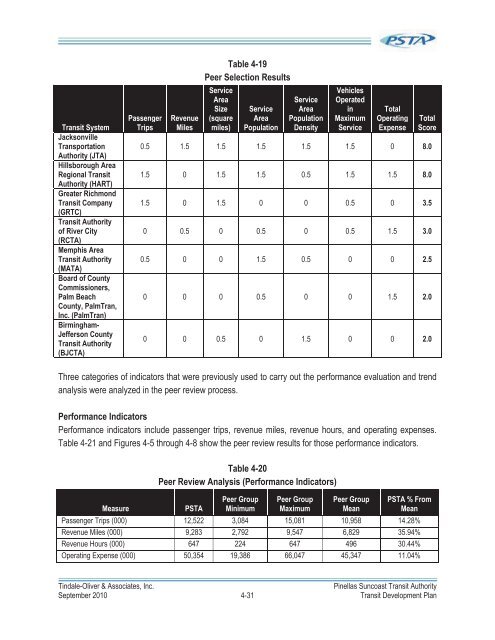
PEER REVIEWA peer review analysis is generally conducted to compare a transit system’s performance at a given point intime with other transit systems having similar operating characteristics. A peer review was conducted usingvalidated 2008 NTD reports for PSTA and all potential peers. Selected performance indicators,effectiveness measures, and efficiency measures are provided throughout this section in tabular format toillustrate the performance of PSTA‘s fixed-route system relative to the peer group. For each selectedindicator and measure, the tables provide the PSTA value, the minimum value among the peer group, themaximum value among the peer group, the mean of the peer group, and the percent that the PSTA’svalues are away from the mean.The peer group selection was based foremost on geographic location within the southeastern U.S.; thestates included were Texas, Louisiana, Arkansas, Mississippi, Alabama, Tennessee, Kentucky, Virginia,North Carolina, South Carolina, Georgia and Florida. All the transit systems in these states were analyzedbased on seven indicators including four operating characteristics (passenger trips, revenue miles, vehiclesoperated in maximum service, and total operating expense) and three exogenous variables (service areasize, service area population, and service area population density).In order to select the systems most comparable with PSTA, each indicator’s value for PSTA was used as abase number. Based on this, 80 percent, 90 percent, 110 percent, and 120 percent of PSTA indicatorvalues were calculated, respectively. Potential peers were assigned a score for each of the indicatorsbased on the following criteria:Peers falling between 90 percent of the PSTA value and 110 percent of the PSTA value wereawarded 1.5 points;Peers falling between 80 percent and 90 percent of the PSTA value or between 110 percent and120 percent of the PSTA value were awarded 0.5 points;Peers falling below 80 percent or above 120 percent of the PSTA value were awarded 0.0 points.The total score for each of the indicators by corresponding peers were then summed based on the abovecriteria. The potential peers were then ranked in descending order and the top seven transit systems wereselected as final peers. The top seven peers obtained a total score of at least 2.0. Table 4-20 displays thefinal results of the peer selection process. In all, three Florida peers appear in the peer group, includingJacksonville Transportation Authority (JTA) (8 points), Hillsborough Area Regional Transit Authority (HART)(8 points), and Palm Beach County (PalmTran) (2 points). The remaining four peers are non-Florida transitsystems.Tindale-Oliver & Associates, Inc.Pinellas Suncoast Transit AuthoritySeptember 2010 4-30 Transit Development Plan
Transit SystemJacksonvilleTransportationAuthority (JTA)Hillsborough AreaRegional TransitAuthority (HART)Greater RichmondTransit Company(GRTC)Transit Authorityof River City(RCTA)Memphis AreaTransit Authority(MATA)Board of CountyCommissioners,Palm BeachCounty, PalmTran,Inc. (PalmTran)Birmingham-Jefferson CountyTransit Authority(BJCTA)PassengerTripsRevenueMilesTable 4-19Peer Selection ResultsServiceAreaSize(squaremiles)ServiceAreaPopulationServiceAreaPopulationDensityVehiclesOperatedinMaximumServiceTotalOperatingExpenseTotalScore0.5 1.5 1.5 1.5 1.5 1.5 0 8.01.5 0 1.5 1.5 0.5 1.5 1.5 8.01.5 0 1.5 0 0 0.5 0 3.50 0.5 0 0.5 0 0.5 1.5 3.00.5 0 0 1.5 0.5 0 0 2.50 0 0 0.5 0 0 1.5 2.00 0 0.5 0 1.5 0 0 2.0Three categories of indicators that were previously used to carry out the performance evaluation and trendanalysis were analyzed in the peer review process.Performance IndicatorsPerformance indicators include passenger trips, revenue miles, revenue hours, and operating expenses.Table 4-21 and Figures 4-5 through 4-8 show the peer review results for those performance indicators.MeasureTable 4-20Peer Review Analysis (Performance Indicators)PSTAPeer GroupMinimumPeer GroupMaximumPeer GroupMeanPSTA % FromMeanPassenger Trips (000) 12,522 3,084 15,081 10,958 14.28%Revenue Miles (000) 9,283 2,792 9,547 6,829 35.94%Revenue Hours (000) 647 224 647 496 30.44%Operating Expense (000) 50,354 19,386 66,047 45,347 11.04%Tindale-Oliver & Associates, Inc.Pinellas Suncoast Transit AuthoritySeptember 2010 4-31 Transit Development Plan