DRAFT
FY 2020 - PSTA
FY 2020 - PSTA
- No tags were found...

Create successful ePaper yourself
Turn your PDF publications into a flip-book with our unique Google optimized e-Paper software.
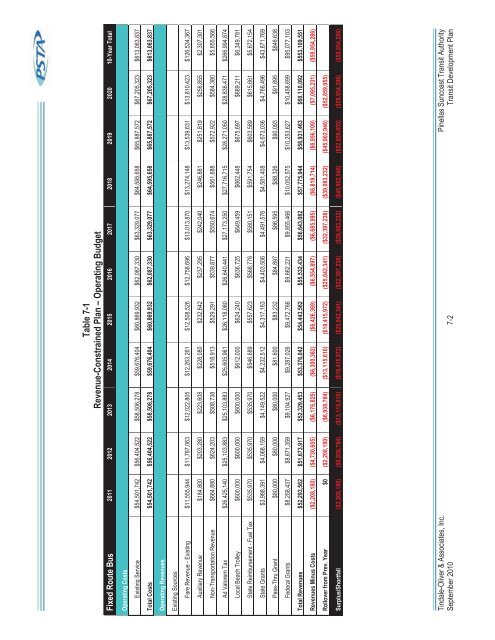
Table 7-1Revenue-Constrained Plan – Operating BudgetFixed Route Bus 2011 2012 2013 2014 2015 2016 2017 2018 2019 2020 10-Year TotalOperating CostsExisting Service $54,501,742 $56,404,522 $58,506,278 $59,676,404 $60,869,932 $62,087,330 $63,329,077 $64,595,658 $65,887,572 $67,205,323 $613,063,837Total Costs $54,501,742 $56,404,522 $58,506,278 $59,676,404 $60,869,932 $62,087,330 $63,329,077 $64,595,658 $65,887,572 $67,205,323 $613,063,837Operating RevenuesExisting SourcesFare Revenue - Existing $11,555,944 $11,787,063 $12,022,805 $12,263,261 $12,508,526 $12,758,696 $13,013,870 $13,274,148 $13,539,631 $13,810,423 $126,534,367Auxiliary Revenue $184,800 $203,280 $223,608 $228,080 $232,642 $237,295 $242,040 $246,881 $251,819 $256,855 $2,307,301Non-Transportation Revenue $664,880 $624,203 $508,738 $518,913 $529,291 $539,877 $550,674 $561,688 $572,922 $584,380 $5,655,566Ad Valorem Tax $26,425,140 $25,103,883 $25,103,883 $25,605,961 $26,118,080 $26,640,441 $27,173,250 $27,716,715 $28,271,050 $28,836,471 $266,994,874Local Beach Trolley $600,000 $600,000 $600,000 $612,000 $624,240 $636,725 $649,459 $662,448 $675,697 $689,211 $6,349,781State Reimbursement - Fuel Tax $535,970 $535,970 $535,970 $546,689 $557,623 $568,776 $580,151 $591,754 $603,589 $615,661 $5,672,154State Grants $3,988,391 $4,068,159 $4,149,522 $4,232,512 $4,317,163 $4,403,506 $4,491,576 $4,581,408 $4,673,036 $4,766,496 $43,671,769Pass-Thru Grant $80,000 $80,000 $80,000 $81,600 $83,232 $84,897 $86,595 $88,326 $90,093 $91,895 $846,638Federal Grants $8,258,437 $8,671,359 $9,104,927 $9,287,026 $9,472,766 $9,662,221 $9,855,466 $10,052,575 $10,253,627 $10,458,699 $95,077,103Total Revenues $52,293,562 $51,673,917 $52,329,453 $53,376,042 $54,443,562 $55,532,434 $56,643,082 $57,775,944 $58,931,463 $60,110,092 $553,109,551Revenues Minus Costs ($2,208,180) ($4,730,605) ($6,176,825) ($6,300,362) ($6,426,369) ($6,554,897) ($6,685,995) ($6,819,714) ($6,956,109) ($7,095,231) ($59,954,286)Rollover from Prev. Year $0 ($2,208,180) ($6,938,784) ($13,115,610) ($19,415,972) ($25,842,341) ($32,397,238) ($39,083,232) ($45,902,946) ($52,859,055)Surplus/Shortfall ($2,208,180) ($6,938,784) ($13,115,610) ($19,415,972) ($25,842,341) ($32,397,238) ($39,083,232) ($45,902,946) ($52,859,055) ($59,954,286) ($59,954,286)Tindale-Oliver & Associates, Inc. Pinellas Suncoast Transit AuthoritySeptember 2010 7-2 Transit Development Plan