DRAFT
FY 2020 - PSTA
FY 2020 - PSTA
- No tags were found...
You also want an ePaper? Increase the reach of your titles
YUMPU automatically turns print PDFs into web optimized ePapers that Google loves.
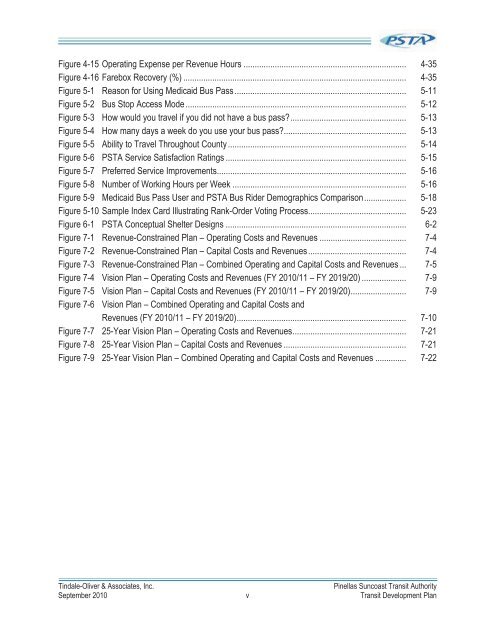
Figure 4-15 Operating Expense per Revenue Hours ......................................................................... 4-35Figure 4-16 Farebox Recovery (%) .................................................................................................... 4-35Figure 5-1 Reason for Using Medicaid Bus Pass ............................................................................. 5-11Figure 5-2 Bus Stop Access Mode ................................................................................................... 5-12Figure 5-3 How would you travel if you did not have a bus pass? .................................................... 5-13Figure 5-4 How many days a week do you use your bus pass? ....................................................... 5-13Figure 5-5 Ability to Travel Throughout County ................................................................................ 5-14Figure 5-6 PSTA Service Satisfaction Ratings ................................................................................. 5-15Figure 5-7 Preferred Service Improvements ..................................................................................... 5-16Figure 5-8 Number of Working Hours per Week .............................................................................. 5-16Figure 5-9 Medicaid Bus Pass User and PSTA Bus Rider Demographics Comparison ................... 5-18Figure 5-10 Sample Index Card Illustrating Rank-Order Voting Process............................................ 5-23Figure 6-1 PSTA Conceptual Shelter Designs ................................................................................. 6-2Figure 7-1 Revenue-Constrained Plan – Operating Costs and Revenues ....................................... 7-4Figure 7-2 Revenue-Constrained Plan – Capital Costs and Revenues ............................................ 7-4Figure 7-3 Revenue-Constrained Plan – Combined Operating and Capital Costs and Revenues ... 7-5Figure 7-4 Vision Plan – Operating Costs and Revenues (FY 2010/11 – FY 2019/20) .................... 7-9Figure 7-5 Vision Plan – Capital Costs and Revenues (FY 2010/11 – FY 2019/20) ......................... 7-9Figure 7-6 Vision Plan – Combined Operating and Capital Costs andRevenues (FY 2010/11 – FY 2019/20) ............................................................................ 7-10Figure 7-7 25-Year Vision Plan – Operating Costs and Revenues ................................................... 7-21Figure 7-8 25-Year Vision Plan – Capital Costs and Revenues ....................................................... 7-21Figure 7-9 25-Year Vision Plan – Combined Operating and Capital Costs and Revenues .............. 7-22Tindale-Oliver & Associates, Inc.Pinellas Suncoast Transit AuthoritySeptember 2010 v Transit Development Plan


