- Page 2 and 3:
PINELLASSUNCOASTTRANSITAUTHORITYTra
- Page 6 and 7:
Map 3-9 Dwelling Unit Density by TA
- Page 8 and 9:
SECTION 1INTRODUCTIONThe Ten-Year T
- Page 10 and 11:
ORGANIZATION OF REPORTIn addition t
- Page 12 and 13:
Improve the project delivery proces
- Page 14 and 15:
Goal: Enrich quality of life and re
- Page 16 and 17:
High-Speed Rail (HSR)In April 2009,
- Page 18 and 19:
ooooPolicy 1.4.8: The MPO shall con
- Page 20 and 21:
According to the Transportation Ele
- Page 23 and 24: were appointed to the PAC by the PS
- Page 25: SECTION 3STUDY AREA CONDITIONS AND
- Page 29 and 30: ANCLOTE RDUS 19ABELCHER RDPASS A GR
- Page 31 and 32: Auto OwnershipBased on the 2000 Cen
- Page 33 and 34: Table 3-4Major Private and Public E
- Page 35 and 36: ANCLOTE RDUS 19ABELCHER RDPASS A GR
- Page 37 and 38: Transportation Disadvantaged Popula
- Page 39 and 40: ANCLOTE RDUS 19ABELCHER RDPASS A GR
- Page 41 and 42: EAST LAKE DRBELCHER RDUS 19ACR 39SR
- Page 43 and 44: Major Trip GeneratorsThe major trip
- Page 45 and 46: Developments of Regional ImpactDeve
- Page 47 and 48: DRI # Project Name Local Govt.15715
- Page 49 and 50: COMMUTING PATTERNSThe 2000 Census p
- Page 51 and 52: Figure 3-6 Figure 3-7% Roadways Abo
- Page 53 and 54: PopulationPinellas County populatio
- Page 55 and 56: SECTION 4EXISTING PSTA SERVICE LEVE
- Page 57 and 58: BELCHER RDUS 19ACR 39SR 58062ND ST
- Page 59 and 60: PSTA FacilitiesIn 2005, PSTA moved
- Page 61 and 62: Table 4-3PSTA Bus Fleet InventoryMa
- Page 63 and 64: Table 4-4 (continued)Inventory of T
- Page 65 and 66: OPERATING STATISTICSThe current ope
- Page 67 and 68: Tables 4-8 and 4-9 include the PSTA
- Page 69 and 70: Table 4-8 (Cont’d)Ridership Analy
- Page 71 and 72: Table 4-9 (Cont’d)Ridership Analy
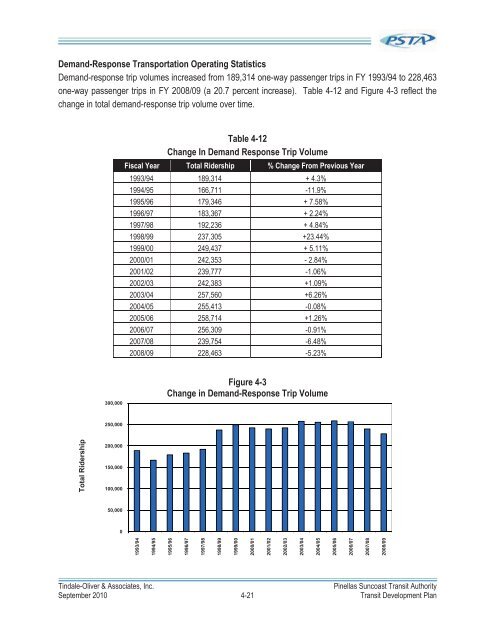
- Page 73: Table 4-10 (Cont’d)Service Profil
- Page 77 and 78: Table 4-13PSTA Cost per Passenger T
- Page 79 and 80: PERFORMANCE EVALUATION AND TRENDSA
- Page 81 and 82: The following is a summary of the t
- Page 83 and 84: Cost Efficiency - This is indicated
- Page 85 and 86: Transit SystemJacksonvilleTransport
- Page 87 and 88: Table 4-21Peer Review Analysis (Eff
- Page 89 and 90: Figure 4-15 Figure 4-16Operating Ex
- Page 91 and 92: SECTION 5MARKET RESEARCH AND PUBLIC
- Page 93 and 94: 10. Travel Training/Travel Aids Pro
- Page 95 and 96: improvements, and PSTA Board meetin
- Page 97 and 98: on-board survey research in conjunc
- Page 99 and 100: Pasco CountyEAST LAKE RDGulfofMexic
- Page 101 and 102: Figure 5-1Reason for Using Medicaid
- Page 103 and 104: Figure 5-3How would you travel if y
- Page 105 and 106: Figure 5-6PSTA Service Satisfaction
- Page 107 and 108: Questions 9 through 13 asked respon
- Page 109 and 110: COMMITTEES AND WORKSHOPSA number of
- Page 111 and 112: think about the issue at hand. Peop
- Page 113 and 114: Figure 5-10Sample Index Card Illust
- Page 115 and 116: Analysis of TAC PrioritiesPriority
- Page 117 and 118: PSTA works closely with the TAC on
- Page 119 and 120: SECTION 6SITUATION APPRAISAL AND NE
- Page 121 and 122: Regional Maintenance Training Facil
- Page 123 and 124: Other areas considered as viable lo
- Page 125 and 126:
Transit Security GrantsPSTA has bee
- Page 127 and 128:
Regional Transportation IssuesOn Ma
- Page 129 and 130:
Land UseAlthough much of the curren
- Page 131 and 132:
Implications - PSTA should prioriti
- Page 133 and 134:
Transit Network - The transit route
- Page 135 and 136:
increase 5.33 percent (from 44,413
- Page 137 and 138:
EAST LAKE DRBELCHER RDUS 19ACR 39SR
- Page 139 and 140:
Table 7-1Revenue-Constrained Plan -
- Page 141 and 142:
Figure 7-1Revenue-Constrained Plan
- Page 143 and 144:
Table 7-3Vision Plan - Operating Bu
- Page 145 and 146:
Table 7-4Vision Plan - Capital Budg
- Page 147 and 148:
Figure 7-6Vision Plan - Combined Op
- Page 149 and 150:
C.R. 77 (ROWAN)N.SUNCOASTTROUBLE CR
- Page 151 and 152:
C.R. 77 (ROWAN)N.SUNCOASTTROUBLE CR
- Page 153 and 154:
Fixed-Guideway Transit (Rail)As ind
- Page 155 and 156:
million. Sales tax revenues are to
- Page 157 and 158:
Table 7-625-Year Vision Plan - Capi
- Page 159 and 160:
Millions$2,500$2,000Figure 7-925-Ye
- Page 161 and 162:
PSTA REVENUE FLEET INVENTORYPSTA BU
- Page 163 and 164:
PSTA SUPERVISOR AND SERVICE VEHICLE
- Page 165 and 166:
12 YEAR SUPPORT VEHICLE REPLACEMENT
- Page 167 and 168:
SECTION 5307 FORMULA FUNDSFY 2010 P
- Page 169 and 170:
ADOPTED FY 2009 AMERICAN RECOVERY A
- Page 171 and 172:
THREE-YEAR OPERATING BUDGET PROJECT
- Page 173 and 174:
APPENDIX EFAREBOX RECOVERY REPORTTi
- Page 175 and 176:
EFFECTIVE FARE CHANGESThe following
- Page 177 and 178:
ApprovedFareModificationstobeeffect
- Page 179 and 180:
Route58Route59Route74Route75Route79
- Page 181 and 182:
HISTORY OF PSTASPECIAL LEGISLATIVE
- Page 183 and 184:
APPENDIX HVision Plan Selected Capi
- Page 185 and 186:
Table H-4Light Rail Station Costs*L
- Page 187 and 188:
Third Penny for Pinellas, Local Inf


