PASCAL Platinum 6th Edition
PASCAL Platinum 2010/11 - Pascal Education
PASCAL Platinum 2010/11 - Pascal Education
- No tags were found...

You also want an ePaper? Increase the reach of your titles
YUMPU automatically turns print PDFs into web optimized ePapers that Google loves.
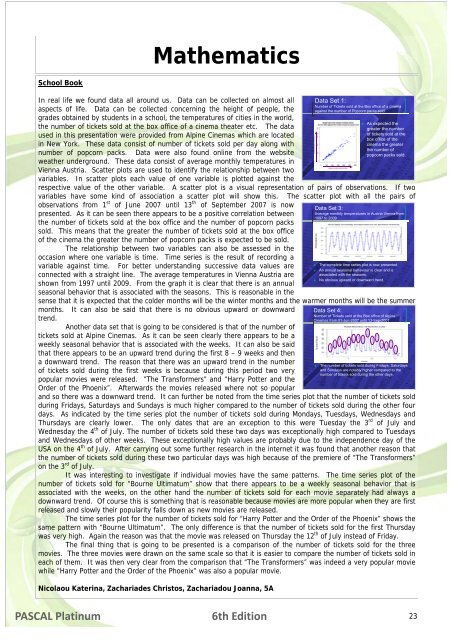
MathematicsSchool BookIn real life we found data all around us. Data can be collected on almost allaspects of life. Data can be collected concerning the height of people, thegrades obtained by students in a school, the temperatures of cities in the world,the number of tickets sold at the box office of a cinema theater etc. The dataused in this presentation were provided from Alpine Cinemas which are locatedin New York. These data consist of number of tickets sold per day along withnumber of popcorn packs. Data were also found online from the websiteweather underground. These data consist of average monthly temperatures inVienna Austria. Scatter plots are used to identify the relationship between twovariables. In scatter plots each value of one variable is plotted against therespective value of the other variable. A scatter plot is a visual representation of pairs of observations. If twovariables have some kind of association a scatter plot will show this. The scatter plot with all the pairs ofobservations from 1 st of June 2007 until 13 th of September 2007 is nowData Set 3:presented. As it can be seen there appears to be a positive correlation betweenAverage monthly temperatures in Austria Vienna from1997 to 2009the number of tickets sold at the box office and the number of popcorn packssold. This means that the greater the number of tickets sold at the box officeof the cinema the greater the number of popcorn packs is expected to be sold.The relationship between two variables can also be assessed in theoccasion where one variable is time. Time series is the result of recording a• The complete time series plot is now presented.variable against time. For better understanding successive data values are• An annual seasonal behaviour is clear and isconnected with a straight line. The average temperatures in Vienna Austria areassociated with the seasons.• No obvious upward or downward trend.36shown from 1997 until 2009. From the graph it is clear that there is an annualseasonal behavior that is associated with the seasons. This is reasonable in thesense that it is expected that the colder months will be the winter months and the warmer months will be the summermonths. It can also be said that there is no obvious upward or downwardtrend.Another data set that is going to be considered is that of the number oftickets sold at Alpine Cinemas. As it can be seen clearly there appears to be aweekly seasonal behavior that is associated with the weeks. It can also be saidthat there appears to be an upward trend during the first 8 – 9 weeks and thena downward trend. The reason that there was an upward trend in the numberof tickets sold during the first weeks is because during this period two verypopular movies were released. “The Transformers” and “Harry Potter and theOrder of the Phoenix”. Afterwards the movies released where not so popularand so there was a downward trend. It can further be noted from the time series plot that the number of tickets soldduring Fridays, Saturdays and Sundays is much higher compared to the number of tickets sold during the other fourdays. As indicated by the time series plot the number of tickets sold during Mondays, Tuesdays, Wednesdays andThursdays are clearly lower. The only dates that are an exception to this were Tuesday the 3 rd of July andWednesday the 4 th of July. The number of tickets sold these two days was exceptionally high compared to Tuesdaysand Wednesdays of other weeks. These exceptionally high values are probably due to the independence day of theUSA on the 4 th of July. After carrying out some further research in the internet it was found that another reason thatthe number of tickets sold during these two particular days was high because of the premiere of “The Transformers”on the 3 rd of July.It was interesting to investigate if individual movies have the same patterns. The time series plot of thenumber of tickets sold for “Bourne Ultimatum” show that there appears to be a weekly seasonal behavior that isassociated with the weeks, on the other hand the number of tickets sold for each movie separately had always adownward trend. Of course this is something that is reasonable because movies are more popular when they are firstreleased and slowly their popularity falls down as new movies are released.The time series plot for the number of tickets sold for “Harry Potter and the Order of the Phoenix” shows thesame pattern with “Bourne Ultimatum”. The only difference is that the number of tickets sold for the first Thursdaywas very high. Again the reason was that the movie was released on Thursday the 12 th of July instead of Friday.The final thing that is going to be presented is a comparison of the number of tickets sold for the threemovies. The three movies were drawn on the same scale so that it is easier to compare the number of tickets sold ineach of them. It was then very clear from the comparison that “The Transformers” was indeed a very popular moviewhile “Harry Potter and the Order of the Phoenix” was also a popular movie.Nicolaou Katerina, Zachariades Christos, Zachariadou Joanna, 5AData Set 1:Number of Tickets sold at the Box office of a cinemaagainst the number of Popcorn packs sold• As expected thegreater the numberof tickets sold at thebox office of thecinema the greaterthe number ofpopcorn packs sold.Data Set 4:Number of Tickets sold at the Box office of AlpineCinemas from 01-Jun-2007 until 13-Sep-2007• The number of tickets sold during Fridays, Saturdaysand Sundays are notably higher compared to thenumber of tickets sold during the other days.1838<strong>PASCAL</strong> <strong>Platinum</strong><strong>6th</strong> <strong>Edition</strong>23