- Page 1 and 2: Version 15.1 User’s Manual Octobe
- Page 3 and 4: Table of Contents Product Overview
- Page 5 and 6: Table of Contents Problem Determina
- Page 7 and 8: Product Overview Performance Naviga
- Page 9 and 10: Understanding the Performance Data
- Page 11 and 12: Installing PN400 This section is th
- Page 13 and 14: Installing PN400 (cont) Step3 will
- Page 15 and 16: Installing PN400 (cont) Next, we ca
- Page 17 and 18: Installing PN400 (cont) Config Perf
- Page 19 and 20: IBM i Performance Navigator Menu To
- Page 21 and 22: IBM i Performance Navigator Menu (c
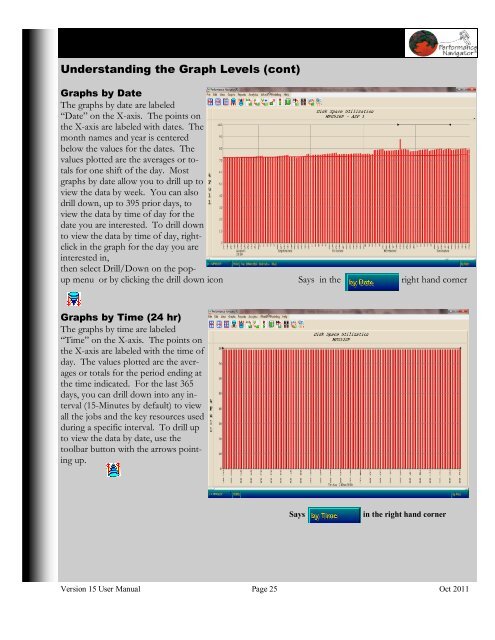
- Page 23: IBM i Performance Navigator Menu (c
- Page 27 and 28: Graphs Available By Category (cont)
- Page 29 and 30: Graphs Available By Category (cont)
- Page 31 and 32: Graphs Available By Category (cont)
- Page 33 and 34: Graphs Available By Category (cont)
- Page 35 and 36: Understanding The GRAPH Menu These
- Page 37 and 38: Screen Options (cont) Analytics The
- Page 39 and 40: Zoom In The first tool bar button i
- Page 41 and 42: Change Scale The 3rd tool bar butto
- Page 43 and 44: Pie Chart This button gives pie cha
- Page 45 and 46: Extrapolate This button will toggle
- Page 47 and 48: 3D Effect This button toggles betwe
- Page 49 and 50: Why Is My Cursor Changing? As you m
- Page 51 and 52: Adjusting the X-Axis - Dragging the
- Page 53 and 54: Filtering & Deleting Data Y-Axis Ri
- Page 55 and 56: Data Scope Indicator The data scope
- Page 57 and 58: Remove Gaps In Data Notice the huge
- Page 59 and 60: Copy Bitmap Select this option will
- Page 61 and 62: File Menu Options The FILE option i
- Page 63 and 64: Edit Menu Options The EDIT “pull
- Page 65 and 66: View Menu Options System Informatio
- Page 67 and 68: View Menu Options (cont) Series Dat
- Page 69 and 70: Graph Menu Options The Graph menu w
- Page 71 and 72: Reports—Spreadsheet Options Note
- Page 73 and 74: Reports Examples (cont) GROUP Repor
- Page 75 and 76:
Reports Examples (cont) Management
- Page 77 and 78:
Reports Examples (cont) Library Cha
- Page 79 and 80:
Reports Examples Rack Detail Report
- Page 81 and 82:
Understanding the PerfNav Key Code
- Page 83 and 84:
CREATING REPORT SETS (cont) Graphs
- Page 85 and 86:
CREATING REPORT SETS (cont) Report
- Page 87 and 88:
CREATING REPORT SETS (cont) Paramet
- Page 89 and 90:
CREATING REPORT SETS (cont) Next, w
- Page 91 and 92:
CREATING REPORT SETS (cont) Upon ch
- Page 93 and 94:
EMAILING REPORT SETS Upon choosing
- Page 95 and 96:
REPORT SET AUTOMATION (cont) Next,
- Page 97 and 98:
REPORT SET AUTOMATION (cont) Next,
- Page 99 and 100:
REPORT SET AUTOMATION (cont) Upon a
- Page 101 and 102:
DELETING REPORT SETS When EDIT / RE
- Page 103 and 104:
Creating User Groups User groups al
- Page 105 and 106:
Creating User Groups (cont) Upon en
- Page 107 and 108:
Creating Job Groups (cont) Upon ent
- Page 109 and 110:
Creating Job Groups (cont) Importin
- Page 111 and 112:
Creating Job Groups (cont) Pasting
- Page 113 and 114:
Displaying PerfNav Group Graphs & R
- Page 115 and 116:
Displaying PerfNav Group Graphs & R
- Page 117 and 118:
The Navigator Panel (cont) Upon tur
- Page 119 and 120:
The Navigator Panel - Graphs Tab Th
- Page 121 and 122:
The Navigator Panel - Reports Tab F
- Page 123 and 124:
Performance Management - Understand
- Page 125 and 126:
Performance Management - Understand
- Page 127 and 128:
Performance Management - Trend Stat
- Page 129 and 130:
Current Trend - Data Projection Win
- Page 131 and 132:
Performance Management - Trend Stat
- Page 133 and 134:
Performance Management - Trend Stat
- Page 135 and 136:
Problem Determination In this secti
- Page 137 and 138:
Problem Determination (cont) Sortin
- Page 139 and 140:
Problem Determination - Filtering T
- Page 141 and 142:
Problem Determination - Viewing Sys
- Page 143 and 144:
Problem Determination - Automated S
- Page 145 and 146:
Problem Determination - Automated S
- Page 147 and 148:
Problem Determination - Automated S
- Page 149 and 150:
Capacity Planning - What If ® Opti
- Page 151 and 152:
Capacity Planning - What If Tabs Mo
- Page 153 and 154:
Capacity Planning - What If Tabs Ad
- Page 155 and 156:
Capacity Planning - What If Tabs Tr
- Page 157 and 158:
Capacity Planning - What If Tabs Tr
- Page 159 and 160:
Capacity Planning - What If Tabs Tr
- Page 161 and 162:
Capacity Planning - What If Tabs Se
- Page 163 and 164:
Capacity Planning - What If Tabs LP
- Page 165 and 166:
Capacity Planning - What If Tabs LP
- Page 167 and 168:
Capacity Planning - What If Tabs DA
- Page 169 and 170:
What If - Saving the Model After cr
- Page 171 and 172:
Understanding Performance Navigator
- Page 173 and 174:
Understanding Performance Navigator
- Page 175 and 176:
Understanding Performance Navigator
- Page 177 and 178:
Understanding Performance Navigator
- Page 179 and 180:
Understanding Performance Navigator
- Page 181 and 182:
Understanding Performance Navigator
- Page 183 and 184:
REPORT SET AUTOMATION (Using Window
- Page 185 and 186:
REPORT SET AUTOMATION (cont) Next,
- Page 187 and 188:
REPORT SET AUTOMATION (cont) Next,
- Page 189 and 190:
SCRIPT AUTOMATION (Using Windows Sc
- Page 191 and 192:
Understanding The Impact Of Changes
- Page 193 and 194:
Understanding The Impact Of Changes
- Page 195 and 196:
Understanding The Impact Of Changes
- Page 197 and 198:
Understanding The Impact Of Changes
- Page 199 and 200:
Before vs After—Measuring HA (Rol
- Page 201 and 202:
Before vs After—Measuring HA (Rol
- Page 203 and 204:
Before vs After—Measuring HA (Rol
- Page 205 and 206:
Before vs After—Measuring HA (Rol
- Page 207 and 208:
Before vs After—Measuring HA (Rol
- Page 209 and 210:
Before vs After—Measuring HA (Rol
- Page 211 and 212:
Before vs After—Measuring HA (Rol
- Page 213 and 214:
Before vs After—Measuring HA (Rol
- Page 215 and 216:
Before vs After—Measuring HA (Rol
- Page 217 and 218:
Before vs After—Measuring HA (Rol
- Page 219 and 220:
Before vs After—Measuring HA (Rol
- Page 221 and 222:
Before vs After—Measuring HA (Rol
- Page 223 and 224:
Before vs After—Measuring HA (Rol
- Page 225:
Before vs After—Measuring HA (Rol
- Page 228:
Before vs After—Measuring HA (Rol
- Page 233:
Before vs After—Measuring HA (Rol
- Page 238 and 239:
Before vs After—Measuring HA (Rol
- Page 240 and 241:
Before vs After—Measuring HA (Rol
- Page 242 and 243:
EXPO (Executive Performance Overvie
- Page 244 and 245:
EXPO (Executive Performance Overvie
- Page 246 and 247:
EXPO (Executive Performance Overvie
- Page 248 and 249:
EXPO (Executive Performance Overvie
- Page 250 and 251:
EXPO (Executive Performance Overvie
- Page 252 and 253:
EXPO (Executive Performance Overvie
- Page 254 and 255:
EXPO (Executive Performance Overvie
- Page 256 and 257:
EXPO (Executive Performance Overvie
- Page 258 and 259:
EXPO (Executive Performance Overvie
- Page 260 and 261:
EXPO (Executive Performance Overvie
- Page 262 and 263:
EXPO (Executive Performance Overvie
- Page 264 and 265:
EXPO (Executive Performance Overvie
- Page 266 and 267:
EXPO (Executive Performance Overvie