Version 15.1 User’s Manual
Version 15.1 User's Manual - Midrange Performance Group
Version 15.1 User's Manual - Midrange Performance Group

You also want an ePaper? Increase the reach of your titles
YUMPU automatically turns print PDFs into web optimized ePapers that Google loves.
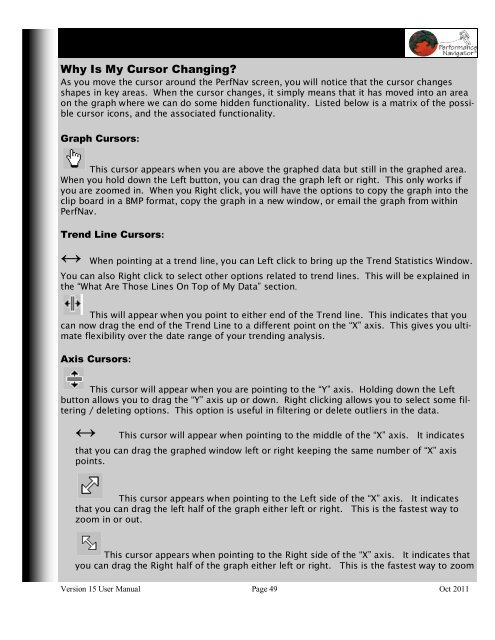
Why Is My Cursor Changing?<br />
As you move the cursor around the PerfNav screen, you will notice that the cursor changes<br />
shapes in key areas. When the cursor changes, it simply means that it has moved into an area<br />
on the graph where we can do some hidden functionality. Listed below is a matrix of the possible<br />
cursor icons, and the associated functionality.<br />
Graph Cursors:<br />
This cursor appears when you are above the graphed data but still in the graphed area.<br />
When you hold down the Left button, you can drag the graph left or right. This only works if<br />
you are zoomed in. When you Right click, you will have the options to copy the graph into the<br />
clip board in a BMP format, copy the graph in a new window, or email the graph from within<br />
PerfNav.<br />
Trend Line Cursors:<br />
↔ When pointing at a trend line, you can Left click to bring up the Trend Statistics Window.<br />
You can also Right click to select other options related to trend lines. This will be explained in<br />
the “What Are Those Lines On Top of My Data” section.<br />
This will appear when you point to either end of the Trend line. This indicates that you<br />
can now drag the end of the Trend Line to a different point on the “X” axis. This gives you ultimate<br />
flexibility over the date range of your trending analysis.<br />
Axis Cursors:<br />
This cursor will appear when you are pointing to the “Y” axis. Holding down the Left<br />
button allows you to drag the “Y” axis up or down. Right clicking allows you to select some filtering<br />
/ deleting options. This option is useful in filtering or delete outliers in the data.<br />
↔ This cursor will appear when pointing to the middle of the “X” axis. It indicates<br />
that you can drag the graphed window left or right keeping the same number of “X” axis<br />
points.<br />
This cursor appears when pointing to the Left side of the “X” axis. It indicates<br />
that you can drag the left half of the graph either left or right. This is the fastest way to<br />
zoom in or out.<br />
This cursor appears when pointing to the Right side of the “X” axis. It indicates that<br />
you can drag the Right half of the graph either left or right. This is the fastest way to zoom<br />
<strong>Version</strong> 15 User <strong>Manual</strong> Page 49 Oct 2011