Version 15.1 User’s Manual
Version 15.1 User's Manual - Midrange Performance Group
Version 15.1 User's Manual - Midrange Performance Group
You also want an ePaper? Increase the reach of your titles
YUMPU automatically turns print PDFs into web optimized ePapers that Google loves.
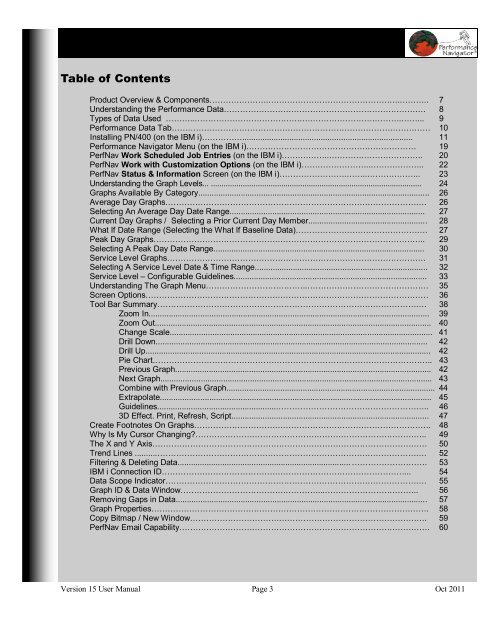
Table of Contents<br />
Product Overview & Components………………….………………………………………….……….. 7<br />
Understanding the Performance Data………………………………………………………………… 8<br />
Types of Data Used ………..………………………………….……………………………….……... 9<br />
Performance Data Tab…………………………………………………………………………………… 10<br />
Installing PN/400 (on the IBM i)……………............................................................................ 11<br />
Performance Navigator Menu (on the IBM i)……………………………………………………… 19<br />
PerfNav Work Scheduled Job Entries (on the IBM i)…….………..…………………………….. 20<br />
PerfNav Work with Customization Options (on the IBM i)……………………..……………….. 22<br />
PerfNav Status & Information Screen (on the IBM i)…………………….……..……………….. 23<br />
Understanding the Graph Levels... ................................................................................................... 24<br />
Graphs Available By Category....................................................................................................... 26<br />
Average Day Graphs……………………………………………………………………………………. 26<br />
Selecting An Average Day Date Range....................................................................................... 27<br />
Current Day Graphs / Selecting a Prior Current Day Member..................................................... 28<br />
What If Date Range (Selecting the What If Baseline Data)…………………………………………. 27<br />
Peak Day Graphs……………………………………………………………………………………….. 29<br />
Selecting A Peak Day Date Range.............................................................................................. 30<br />
Service Level Graphs…………………………………………………………………………………… 31<br />
Selecting A Service Level Date & Time Range............................................................................. 32<br />
Service Level – Configurable Guidelines...................................................................................... 33<br />
Understanding The Graph Menu………………………………..……………………………………… 35<br />
Screen Options…………………………………………………………………………………………… 36<br />
Tool Bar Summary………………………………………………………………………………………. 38<br />
Zoom In............................................................................................................................. 39<br />
Zoom Out........................................................................................................................... 40<br />
Change Scale..................................................................................................................... 41<br />
Drill Down......................................................................................................................... 42<br />
Drill Up............................................................................................................................... 42<br />
Pie Chart………………………………………………………………………………………….. 43<br />
Previous Graph.................................................................................................................. 42<br />
Next Graph......................................................................................................................... 43<br />
Combine with Previous Graph............................................................................................. 44<br />
Extrapolate......................................................................................................................... 45<br />
Guidelines......................................................……………………………………………….. 46<br />
3D Effect. Print, Refresh, Script........................................................................................ 47<br />
Create Footnotes On Graphs……………………………………………………………………………. 48<br />
Why Is My Cursor Changing?………………………………………………………………………….. 49<br />
The X and Y Axis………………………………………………………………………………………… 50<br />
Trend Lines ..........………………………………………………………………………………………. 52<br />
Filtering & Deleting Data............................................................................. ………………………. 53<br />
IBM i Connection ID………………………………………………………………………………... 54<br />
Data Scope Indicator……………………………………………………………………………………. 55<br />
Graph ID & Data Window……………………………………………...…………………………….. 56<br />
Removing Gaps in Data................................................................................................................ 57<br />
Graph Properties…………………………………………………………………………………………. 58<br />
Copy Bitmap / New Window……………………………………………………………………………. 59<br />
PerfNav Email Capability………………………………………………………………………………… 60<br />
<strong>Version</strong> 15 User <strong>Manual</strong> Page 3 Oct 2011


