

Periodical
STATISTICAL REPORT '11 - Floor Covering Institute
STATISTICAL REPORT '11 - Floor Covering Institute
- No tags were found...

Create successful ePaper yourself
Turn your PDF publications into a flip-book with our unique Google optimized e-Paper software.
16<br />
Tile & Stone<br />
Tile & stone inch ahead<br />
By Tanja Kern<br />
2011 tile and stone numbers showed that<br />
the U.S. really is seeing the “beginning of the<br />
end” of the recession.<br />
Ceramic tile dollar sales increased by 6<br />
percent to $2.21 billion, while square foot<br />
sales rose by 4.5 percent to 2.08 billion — the<br />
highest rate for any flooring material. Stone<br />
sales were up 0.2 percent to $1.06 billion —<br />
and square foot sales nudged up 0.57 percent<br />
to 261.5 million square feet.<br />
“It was not a great year, but we have already<br />
hit bottom, and we are a little bit ahead of<br />
before,” said Donato Grosser, consultant to<br />
the tile industry and owner of D. Grosser &<br />
Associates, Ltd.<br />
As the overall economy recovered in 2011,<br />
manufacturers felt confident enough to pass<br />
along rising material, energy and transportation<br />
costs to consumers, but price competitiveness<br />
actually improved for ceramic tile<br />
because the sector experienced only moderate<br />
raw material cost increases.<br />
The average square foot price stayed steady<br />
in 2011 — up just a penny. According to<br />
Catalina Research, average square foot selling<br />
prices stood at $1.06 per square foot in 2011<br />
with the category gaining market share — 12.4<br />
percent of total U.S. floor covering dollar sales.<br />
As the struggling housing market shows<br />
signs of improvement, there has been a reversal<br />
in the six-year trend in smaller home sizes,<br />
according to the American Institute of Architects.<br />
This is the case for custom and luxury<br />
homes, as well as for additions to existing<br />
homes. A preference for outdoor living, especially<br />
blended indoor/outdoor living, continues<br />
to increase. These consumer preferences<br />
are opening more doors for natural stone and<br />
high quality porcelain tiles.<br />
Segment breakdown<br />
The current administration’s recent housing<br />
scorecard shows signs of burgeoning<br />
stability in the housing market, with home<br />
equity numbers rising 7.4 percent between<br />
the fourth quarter of 2011 and the first quarter<br />
of 2012. The scorecard, which is compiled<br />
by the U.S. Department of Housing and<br />
Urban Development, the Obama administration<br />
and Treasury, noted that home equity<br />
rose $457.1 billion in the first quarter of 2012.<br />
Catalina Research market segment analysis<br />
showed that homeowners are investing in<br />
their homes with 41 percent of ceramic tile<br />
sales going to residential replacement in 2011.<br />
“Last year was better commercially and we<br />
are seeing some movement in hospitality,<br />
multi-family housing and retail,” said Lori<br />
Kirk-Rolley, senior marketing director for<br />
Dal-Tile. “I think that there is a lot of pent up<br />
demand and we are seeing a lot of that on our<br />
national accounts, on the retail side and with<br />
large retailers.”<br />
Non-residential construction accounted<br />
for 25 percent of the tile market. The commercial<br />
contract market held 19 percent of<br />
the tile market.<br />
“The commercial market is where we<br />
are seeing the growth for Florida Tile,” said<br />
Florida Tile marketing director Sean Cilona.<br />
“The hospitality and healthcare segments are<br />
doing pretty well and those smaller commercial<br />
jobs — those types where people are<br />
installing tile as a replacement floor coverings<br />
are also doing well.”<br />
Gianni Mattioli, president of Marazzi USA,<br />
added, “We are already established in the<br />
residential remodeling market and business<br />
is picking up, but the commercial markets are<br />
where we have made a lot of key investments<br />
in people, marketing and technology.”<br />
Import/Export<br />
Although imports still comprise the majority<br />
of U.S. consumption, due to the U.S. dollar<br />
losing value to the Euro, import market penetration<br />
has fallen in each of the last five years.<br />
In 2011, imports accounted for 69.2 percent of<br />
U.S. ceramic tile consumption — the lowest it<br />
has been since 1998, according to Eric Astrachan,<br />
executive director of the Tile Council of<br />
North America (TCNA). “As you can see, we<br />
are moving in the right direction,” he said.<br />
There are six Italian-owned tile plants in the<br />
United States — Marazzi USA with three locations,<br />
Florim USA, Iris-Stonepeak and Florida<br />
Tile. According to Ceramics of Italy, the Italian<br />
tile association, those plants make up 50 percent<br />
of U.S. ceramic tile production. “These companies<br />
invested in the United State due mainly to<br />
weaknesses in the dollar,” Grosser said.<br />
2011 key points<br />
Sales remained on the rise as consumers<br />
continue to turn to hard surface flooring.<br />
Ceramic tile value increased by 6.3 percent<br />
to $2.21 billion, while volume rose<br />
by 4.5 percent to $2.08 billion.<br />
While imports still comprise the majority<br />
of U.S. consumption and sales of imports<br />
continue to grow (by 3.8 percent in 2011,<br />
according to Catalina) the TCNA said that<br />
imported product’s market share in comparison<br />
to domestically made tile declined<br />
over the last five years to 69.2 percent.<br />
Look ahead<br />
Despite the lingering effects of an overbuilt<br />
housing market, the continued difficulty<br />
to obtain financing for real estate projects,<br />
budget shortfalls and the anxiety surrounding<br />
the prolonged European debt crisis, there<br />
are signs that the U.S. design and construction<br />
industry will be improving and with it,<br />
along with tile and stone industry.<br />
Improved price competitiveness and<br />
consumers’ overall rising preference for hard<br />
surface flooring has already helped ceramic<br />
tile experience some of the strongest industry<br />
gains in the first half of 2012.<br />
Ceramic tile sales (shipments minus exports<br />
plus imports) are estimated to increase by 6.5<br />
percent in square feet and 7.7 percent in dollars<br />
in the first half of 2012 over the previous year,<br />
according to Catalina’s second quarter report<br />
for 2012. This could push ceramic tile square<br />
foot sales to account for 12.3 percent of total<br />
U.S. floor coverings square foot sales in the first<br />
half, and 12.7 percent on a dollar basis. FCW<br />
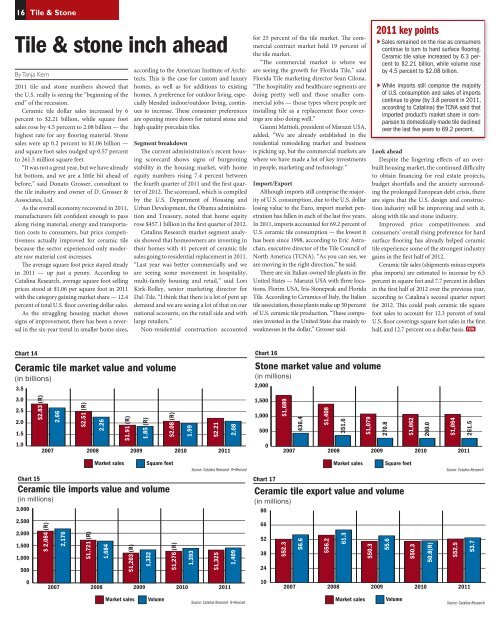
Chart 14<br />
Ceramic tile market value and volume<br />
(in billions)<br />
3.5<br />
3.0<br />
2.5<br />
2.0<br />
1.5<br />
1.0<br />
$2.83 (R)<br />
2.66<br />
$2.51 (R)<br />
2.26<br />
$1.91 (R)<br />
2007 2008 2009 2010 2011<br />
1.85 (R)<br />
$2.08 (R)<br />
1.99<br />
$2.21<br />
2.08<br />
Chart 16<br />
Stone market value and volume<br />
(in millions)<br />
2,000<br />
1,500<br />
1,000<br />
500<br />
0<br />
$1,689<br />
436.4<br />
$1,408<br />
351.6<br />
$1,079<br />
2007 2008 2009 2010 2011<br />
270.8<br />
$1,062<br />
260.0<br />
$1,064<br />
261.5<br />
Chart 15<br />
Market sales<br />
Square feet<br />
Ceramic tile imports value and volume<br />
(in millions)<br />
3,000<br />
Source: Catalina Research R=Revised<br />
Market sales Square feet<br />
Chart 17<br />
Ceramic tile export value and volume<br />
(in millions)<br />
80<br />
Source: Catalina Research<br />
2,500<br />
2,000<br />
1,500<br />
1,000<br />
500<br />
$ 2,084 (R)<br />
2,176<br />
$1,721 (R)<br />
1,684<br />
$1,203 (R)<br />
1,332<br />
$1,276 (R)<br />
1,393<br />
$1,325<br />
1,409<br />
66<br />
52<br />
38<br />
24<br />
$52.3<br />
56.6<br />
$56.2<br />
61.3<br />
$50.3<br />
55.6<br />
$50.3<br />
50.8(R)<br />
$52.5<br />
53.7<br />
0<br />
2007 2008 2009 2010 2011<br />
10<br />
2007 2008 2009 2010 2011<br />
Market sales<br />
Volume<br />
Source: Catalina Research R=Revised<br />
Market sales<br />
Volume<br />
Source: Catalina Research