- Page 1 and 2:
Evidence Report/Technology Assessme
- Page 3 and 4:
This report is based on research co
- Page 5 and 6:
Key Informants In designing the stu
- Page 7 and 8:
Peer Reviewers Prior to publication
- Page 9 and 10:
HbA 1c reduction were more often de
- Page 11 and 12:
KQ 6. Subgroups for Factors Moderat
- Page 13 and 14:
Figure 13. Behavioral programs for
- Page 15 and 16:
glycemia in reducing the incidence
- Page 17 and 18:
together with one or more additiona
- Page 19 and 20:
Figure A. Analytic framework for be
- Page 21 and 22:
Methods Literature Search Strategy
- Page 23 and 24:
With input from our Technical Exper
- Page 25 and 26:
participants had suboptimal baselin
- Page 27 and 28:
duration of diabetes ranged from 2.
- Page 29 and 30:
Table B. Type 1 diabetes: summary o
- Page 31 and 32:
T2DM: Description and Risk of Bias
- Page 33 and 34:
Figure D. Plot of network meta-anal
- Page 35 and 36:
The positive findings for behaviora
- Page 37 and 38:
elated to the Human Development Ind
- Page 39 and 40:
Table D. Potential research needs b
- Page 41 and 42:
References 1. Renders CM, Valk GD,
- Page 43 and 44:
37. Chodosh J, Morton SC, Mojica W,
- Page 45 and 46:
Introduction Background The high bu
- Page 47 and 48:
Factors other than blood glucose co
- Page 49 and 50:
may include interventions related t
- Page 51 and 52:
programs. The overarching boxes (co
- Page 53 and 54:
Figure 2. Analytic framework for be
- Page 55 and 56:
American Diabetes Association, Amer
- Page 57 and 58: Table 1. Inclusion criteria for typ
- Page 59 and 60: S1 in the Supplementary File). The
- Page 61 and 62: clinically significant); we refer t
- Page 63 and 64: Synthesis for T1DM (KQs 1-4) KQ 1:
- Page 65 and 66: conducted for HbA 1c and body mass
- Page 67 and 68: Applicability We followed the Metho
- Page 69 and 70: Type 1 Diabetes Mellitus This secti
- Page 71 and 72: therapy, 90,99,108 motivational enh
- Page 73 and 74: and a peer (with diabetes and train
- Page 75 and 76: followup (low SOE for both); there
- Page 77 and 78: Figure 6. Behavioral programs for t
- Page 79 and 80: similar results were found for yout
- Page 81 and 82: HbA 1c : Comparative Effectiveness
- Page 83 and 84: Two trials reported on adherence to
- Page 85 and 86: Table 4. Other clinical and behavio
- Page 87 and 88: Figure 14. Behavioral programs for
- Page 89 and 90: Health-Related Quality of Life: Beh
- Page 91 and 92: estimated effects were imprecise an
- Page 93 and 94: Table 8. Type 1 diabetes: summary o
- Page 95 and 96: Summary of Key Findings and Strengt
- Page 97 and 98: studies 82,94,95,105,109,112 were n
- Page 99 and 100: studied a DSME program in patients
- Page 101 and 102: I 2 =74%), 135,137,139,141,142,145,
- Page 103 and 104: Aerobic Fitness Test which estimate
- Page 105 and 106: Key Points: Body Mass Index • Lif
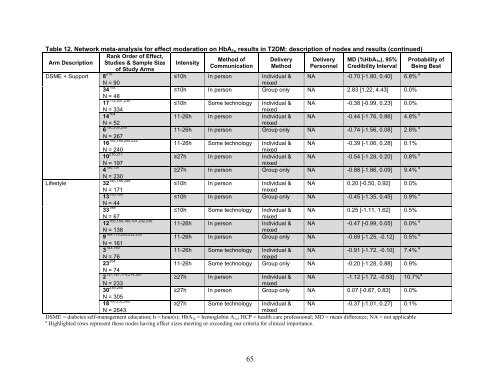
- Page 107: Table 12. Network meta-analysis for
- Page 111 and 112: Table 13. Network meta-analysis for
- Page 113 and 114: Figure 20. Plot of network meta-ana
- Page 115 and 116: active comparator (20 trials, 7,709
- Page 117 and 118: Discussion Key Findings and Discuss
- Page 119 and 120: to be tempered by the findings of n
- Page 121 and 122: compared with usual care. There was
- Page 123 and 124: Our finding that single-topic, non-
- Page 125 and 126: In their systematic review and meta
- Page 127 and 128: For studies targeting adults, the m
- Page 129 and 130: environmental contextual factors—
- Page 131 and 132: assessors was also rarely reported,
- Page 133 and 134: Tailoring programs to ethnic minori
- Page 135 and 136: 17. Centers for Disease Control and
- Page 137 and 138: 53. Medical Advisory Secretariat. B
- Page 139 and 140: 88. Ellis DA, Templin T, Naar-King
- Page 141 and 142: 122. Nansel TR, Iannotti RJ, Simons
- Page 143 and 144: 158. Cooper H, Booth K, Gill G. A t
- Page 145 and 146: 191. Koo BK, Han KA, Ahn HJ, et al.
- Page 147 and 148: 224. Sevick MA, Korytkowski M, Ston
- Page 149 and 150: 260. Yuan C, Lai CW, Chan LW, et al
- Page 151 and 152: 295. Ayling K, Brierley S, Johnson
- Page 153 and 154: Appendix A. Operational Definitions
- Page 155 and 156: the structured diet or physical act
- Page 157 and 158: Appendix B. Literature Search Strat
- Page 159 and 160:
1. MeSH descriptor: [Diabetes Melli
- Page 161 and 162:
35. “blood glucose” N2 monitor*
- Page 163 and 164:
35. (behavio?r adj2 therap*).mp. 36
- Page 165 and 166:
52. exp animals/ not humans.sh. 53.
- Page 167 and 168:
57. "Follow-Up Studies"[Mesh] 58. "
- Page 169 and 170:
URL provided by Michelle Crain, AAD
- Page 171 and 172:
WHO ICTRP Trial Registry: WHO ICTRP
- Page 173 and 174:
Appendix D. Studies Excluded After
- Page 175 and 176:
Health. 2006;6:134. PMID: 16709243.
- Page 177 and 178:
November/December;24(9):450-6. PMID
- Page 179 and 180:
89. Dinneen SF, O'hara MC, Byrne M,
- Page 181 and 182:
119. Fitzpatrick SL, Jeffery R, Joh
- Page 183 and 184:
Aug;19(8):835-42. PMID: 8842601. Ex
- Page 185 and 186:
adherence and metabolic control. Di
- Page 187 and 188:
May;36(5):1297-303. PMID: 23223405.
- Page 189 and 190:
244. Korytkowski MT, Koerbel GL, Ko
- Page 191 and 192:
275. Maljanian R, Grey N, Staff I,
- Page 193 and 194:
306. Naccashian Z. The impact of di
- Page 195 and 196:
led structured program on blood glu
- Page 197 and 198:
Engineering. 2014;75(1-B E). PMID:
- Page 199 and 200:
395. Skoro-Kondza L, Tai SS, Gadelr
- Page 201 and 202:
426. Torbjornsen A, Jenum AK, Smast
- Page 203 and 204:
Americans with type 2 diabetes. J A
- Page 205 and 206:
patients. Diabetes Res Clin Pract.
- Page 207 and 208:
Table E1. Risk of bias for studies
- Page 209 and 210:
Weinger, 2011 L M NA M NA L NA L L
- Page 211 and 212:
Cramer, 2007 M M H M H L H H L M H
- Page 213 and 214:
Ridgeway, 1999 M M H M H L H H M L
- Page 215 and 216:
Appendix F. Description of Studies
- Page 217 and 218:
Author, Year & Country Comparison &
- Page 219 and 220:
Author, Year & Country Comparison &
- Page 221 and 222:
Author, Year & Country Comparison &
- Page 223 and 224:
Author, Year & Country Comparison &
- Page 225 and 226:
Table F3. Description of studies an
- Page 227 and 228:
Author, Year & Country Comparison &
- Page 229 and 230:
Author, Year & Country Comparison &
- Page 231 and 232:
Author, Year & Country Comparison &
- Page 233 and 234:
Author, Year & Country Comparison &
- Page 235 and 236:
Author, Year & Country Comparison &
- Page 237 and 238:
Author, Year & Country Comparison &
- Page 239 and 240:
Author, Year & Country Comparison &
- Page 241 and 242:
Author, Year & Country Comparison &
- Page 243 and 244:
Author, Year & Country Comparison &
- Page 245 and 246:
Author, Year & Country Comparison &
- Page 247 and 248:
Author, Year & Country Comparison &
- Page 249 and 250:
Author, Year & Country Comparison &
- Page 251 and 252:
Author, Year & Country Comparison &
- Page 253 and 254:
Author, Year & Country Comparison &
- Page 255 and 256:
Author, Year & Country Comparison &
- Page 257 and 258:
Author, Year & Country Comparison &
- Page 259 and 260:
Author, Year & Country Comparison &
- Page 261 and 262:
Author, Year & Country Comparison &
- Page 263 and 264:
Author, Year & Country Comparison &
- Page 265 and 266:
Author, Year & Country Comparison &
- Page 267 and 268:
Author, Year & Country Comparison &
- Page 269 and 270:
Author, Year & Country Comparison &
- Page 271 and 272:
Author, Year & Country Comparison &
- Page 273 and 274:
Author, Year & Country Comparison &
- Page 275 and 276:
Author, Year & Country Comparison &
- Page 277 and 278:
Appendix H. Strength of Evidence Ta
- Page 279 and 280:
Outcome # Trials (# Subjects); Tool
- Page 281 and 282:
Table H3. Behavioral programs compa
- Page 283 and 284:
16. Mayer-Davis EJ, Seid M, Crandel
- Page 285 and 286:
Table I1. Effectiveness of behavior
- Page 287 and 288:
Category Health Outcomes Outcomes A
- Page 289 and 290:
Table I2. Effectiveness of behavior
- Page 291 and 292:
Category Outcomes Timepoint Health
- Page 293 and 294:
Outcome Change in Body Composition
- Page 295 and 296:
Outcome Change in Physical Activity
- Page 297 and 298:
References for Appendix I 1. Adachi
- Page 299 and 300:
32. Rock CL, Flatt SW, Pakiz B, et
- Page 301 and 302:
follow-up study. Diabetes Res Clin
- Page 303 and 304:
98. Johnson ST, Bell GJ, Mccargar L
- Page 305 and 306:
Appendix J. Network Meta-Analysis R
- Page 307 and 308:
5 11-26h In person Group only NA -0
- Page 309 and 310:
9 11-26h In person Group only NA -0