

Behavioral Programs for Diabetes Mellitus
diabetes-behavior-programs-report-150924
diabetes-behavior-programs-report-150924
- No tags were found...

Create successful ePaper yourself
Turn your PDF publications into a flip-book with our unique Google optimized e-Paper software.
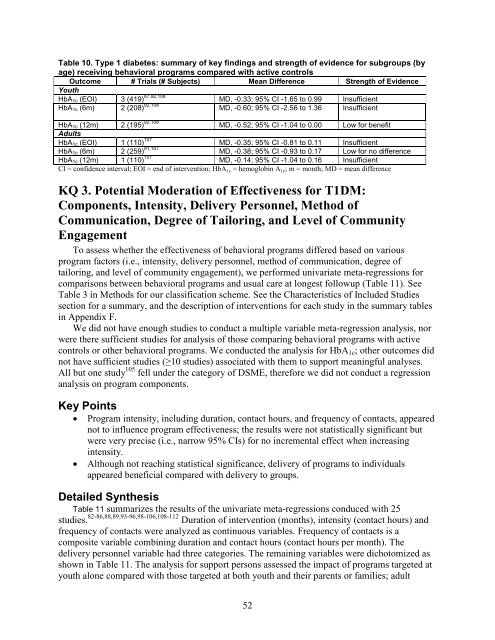
Table 10. Type 1 diabetes: summary of key findings and strength of evidence <strong>for</strong> subgroups (by<br />
age) receiving behavioral programs compared with active controls<br />
Outcome # Trials (# Subjects) Mean Difference Strength of Evidence<br />
Youth<br />
HbA 1c (EOI) 3 (419) 87,92,108 MD, -0.33; 95% CI -1.65 to 0.99 Insufficient<br />
HbA 1c (6m) 2 (208) 92,108 MD, -0.60; 95% CI -2.56 to 1.36 Insufficient<br />
HbA 1c (12m) 2 (195) 92,108 MD, -0.52; 95% CI -1.04 to 0.00 Low <strong>for</strong> benefit<br />
Adults<br />
HbA 1c (EOI) 1 (110) 107 MD, -0.35; 95% CI -0.81 to 0.11 Insufficient<br />
HbA 1c (6m) 2 (259) 91,107 MD, -0.38; 95% CI -0.93 to 0.17 Low <strong>for</strong> no difference<br />
HbA 1c (12m) 1 (110) 107 MD, -0.14; 95% CI -1.04 to 0.16 Insufficient<br />
CI = confidence interval; EOI = end of intervention; HbA 1c = hemoglobin A 1c ; m = month; MD = mean difference<br />
KQ 3. Potential Moderation of Effectiveness <strong>for</strong> T1DM:<br />
Components, Intensity, Delivery Personnel, Method of<br />
Communication, Degree of Tailoring, and Level of Community<br />
Engagement<br />
To assess whether the effectiveness of behavioral programs differed based on various<br />
program factors (i.e., intensity, delivery personnel, method of communication, degree of<br />
tailoring, and level of community engagement), we per<strong>for</strong>med univariate meta-regressions <strong>for</strong><br />
comparisons between behavioral programs and usual care at longest followup (Table 11). See<br />
Table 3 in Methods <strong>for</strong> our classification scheme. See the Characteristics of Included Studies<br />
section <strong>for</strong> a summary, and the description of interventions <strong>for</strong> each study in the summary tables<br />
in Appendix F.<br />
We did not have enough studies to conduct a multiple variable meta-regression analysis, nor<br />
were there sufficient studies <strong>for</strong> analysis of those comparing behavioral programs with active<br />
controls or other behavioral programs. We conducted the analysis <strong>for</strong> HbA 1c ; other outcomes did<br />
not have sufficient studies (≥10 studies) associated with them to support meaningful analyses.<br />
All but one study 105 fell under the category of DSME, there<strong>for</strong>e we did not conduct a regression<br />
analysis on program components.<br />
Key Points<br />
• Program intensity, including duration, contact hours, and frequency of contacts, appeared<br />
not to influence program effectiveness; the results were not statistically significant but<br />
were very precise (i.e., narrow 95% CIs) <strong>for</strong> no incremental effect when increasing<br />
intensity.<br />
• Although not reaching statistical significance, delivery of programs to individuals<br />
appeared beneficial compared with delivery to groups.<br />
Detailed Synthesis<br />
Table 11 summarizes the results of the univariate meta-regressions conduced with 25<br />
studies. 82-86,88,89,93-96,98-106,108-112 Duration of intervention (months), intensity (contact hours) and<br />
frequency of contacts were analyzed as continuous variables. Frequency of contacts is a<br />
composite variable combining duration and contact hours (contact hours per month). The<br />
delivery personnel variable had three categories. The remaining variables were dichotomized as<br />
shown in Table 11. The analysis <strong>for</strong> support persons assessed the impact of programs targeted at<br />
youth alone compared with those targeted at both youth and their parents or families; adult<br />
52