

SOUTH AFRICA’S
1HAwfit
1HAwfit

Create successful ePaper yourself
Turn your PDF publications into a flip-book with our unique Google optimized e-Paper software.
II. THE STATE OF THE GAUTENG CITY-REGION’S<br />
ECONOMY<br />
The Gauteng City-Region is the economic engine of South Africa.<br />
Anchored by the three metropolitan municipalities of Johannesburg,<br />
Ekurhuleni (East Rand), and Tshwane (Pretoria), the city-region housed<br />
12.9 million people and accounted for approximately 24 percent of<br />
national population and 35 percent of the South African economy in 2014. 18<br />
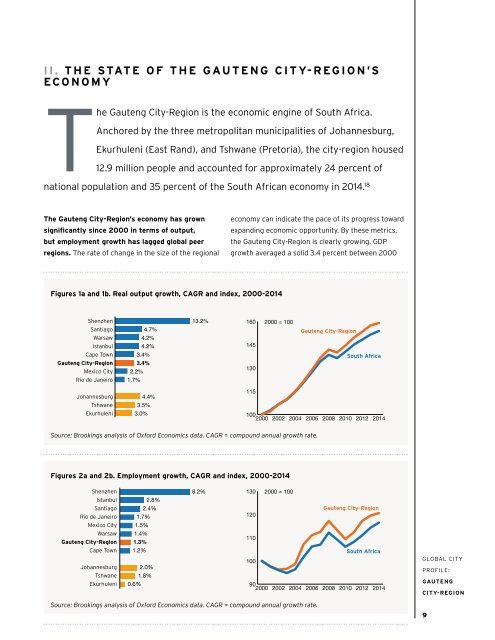
The Gauteng City-Region’s economy has grown<br />
significantly since 2000 in terms of output,<br />
but employment growth has lagged global peer<br />
regions. The rate of change in the size of the regional<br />
economy can indicate the pace of its progress toward<br />
expanding economic opportunity. By these metrics,<br />
the Gauteng City-Region is clearly growing. GDP<br />
growth averaged a solid 3.4 percent between 2000<br />
Figures 1a and 1b. Real output growth, CAGR and index, 2000-2014<br />
Shenzhen<br />
Santiago<br />
Warsaw<br />
Istanbul<br />
Cape Town<br />
Gauteng City-Region<br />
Mexico City<br />
Rio de Janeiro<br />
4.7%<br />
4.2%<br />
4.2%<br />
3.4%<br />
3.4%<br />
2.2%<br />
1.7%<br />
13.2%<br />
160<br />
145<br />
130<br />
2000 = 100<br />
Gauteng City-Region<br />
South Africa<br />
Johannesburg<br />
Tshwane<br />
Ekurhuleni<br />
3.5%<br />
3.0%<br />
4.4%<br />
115<br />
100<br />
2000<br />
2002<br />
2004<br />
2006<br />
2008<br />
2010<br />
2012<br />
2014<br />
Source: Brookings analysis of Oxford Economics data. CAGR = compound annual growth rate.<br />
Figures 2a and 2b. Employment growth, CAGR and index, 2000-2014<br />
Shenzhen<br />
8.2%<br />
130 2000 = 100<br />
Istanbul<br />
2.8%<br />
Santiago 2.4%<br />
Gauteng City-Region<br />
Rio de Janeiro 1.7%<br />
120<br />
Mexico City 1.5%<br />
Warsaw 1.4%<br />
Gauteng City-Region 1.3%<br />
110<br />
Cape Town 1.2%<br />
South Africa<br />
100<br />
Johannesburg 2.0%<br />
Tshwane 1.8%<br />
Ekurhuleni 0.6%<br />
90<br />
2000 2002 2004 2006 2008 2010 2012 2014<br />
Source: Brookings analysis of Oxford Economics data. CAGR = compound annual growth rate.<br />
GLOBAL CITY<br />
PROFILE:<br />
GAUTENG<br />
CITY-REGION<br />
9