

SOUTH AFRICA’S
1HAwfit
1HAwfit

Create successful ePaper yourself
Turn your PDF publications into a flip-book with our unique Google optimized e-Paper software.
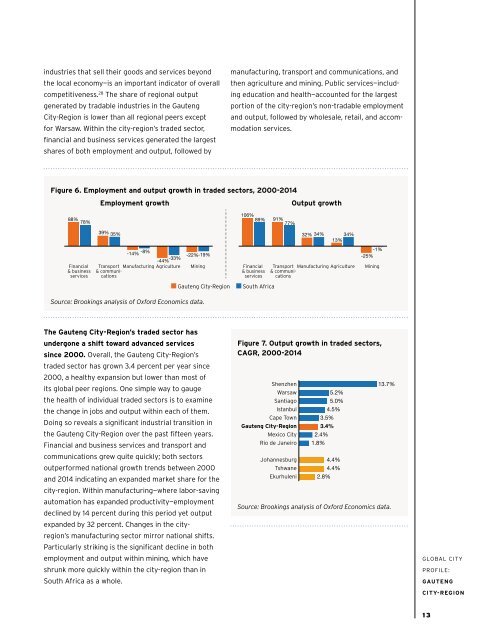
industries that sell their goods and services beyond<br />
the local economy—is an important indicator of overall<br />
competitiveness. 28 The share of regional output<br />
generated by tradable industries in the Gauteng<br />
City-Region is lower than all regional peers except<br />
for Warsaw. Within the city-region’s traded sector,<br />
financial and business services generated the largest<br />
shares of both employment and output, followed by<br />
manufacturing, transport and communications, and<br />
then agriculture and mining. Public services—including<br />
education and health—accounted for the largest<br />
portion of the city-region’s non-tradable employment<br />
and output, followed by wholesale, retail, and accommodation<br />
services.<br />
Figure 6. Employment and output growth in traded sectors, 2000-2014<br />
Employment growth<br />
Output growth<br />
88% 78%<br />
39% 35%<br />
-14% -8% -44% -33% -22%-19% 106%<br />
89% 91%<br />
77%<br />
32% 34%<br />
34%<br />
13%<br />
-1%<br />
-25%<br />
Financial<br />
& business<br />
services<br />
Transport Manufacturing Agriculture<br />
& communications<br />
Mining<br />
Financial<br />
& business<br />
services<br />
Transport Manufacturing Agriculture<br />
& communications<br />
Mining<br />
■ Gauteng City-Region<br />
■ South Africa<br />
Source: Brookings analysis of Oxford Economics data.<br />
The Gauteng City-Region’s traded sector has<br />
undergone a shift toward advanced services<br />
since 2000. Overall, the Gauteng City-Region’s<br />
traded sector has grown 3.4 percent per year since<br />
2000, a healthy expansion but lower than most of<br />
its global peer regions. One simple way to gauge<br />
the health of individual traded sectors is to examine<br />
the change in jobs and output within each of them.<br />
Doing so reveals a significant industrial transition in<br />
the Gauteng City-Region over the past fifteen years.<br />
Financial and business services and transport and<br />
communications grew quite quickly; both sectors<br />
outperformed national growth trends between 2000<br />
and 2014 indicating an expanded market share for the<br />
city-region. Within manufacturing—where labor-saving<br />
automation has expanded productivity—employment<br />
declined by 14 percent during this period yet output<br />
expanded by 32 percent. Changes in the cityregion’s<br />
manufacturing sector mirror national shifts.<br />
Particularly striking is the significant decline in both<br />
employment and output within mining, which have<br />
shrunk more quickly within the city-region than in<br />
South Africa as a whole.<br />
Figure 7. Output growth in traded sectors,<br />
CAGR, 2000-2014<br />
Shenzhen<br />
Warsaw<br />
Santiago<br />
Istanbul<br />
Cape Town<br />
Gauteng City-Region<br />
Mexico City<br />
Rio de Janeiro<br />
Johannesburg<br />
Tshwane<br />
Ekurhuleni<br />
2.4%<br />
1.8%<br />
3.5%<br />
3.4%<br />
2.8%<br />
5.2%<br />
5.0%<br />
4.5%<br />
4.4%<br />
4.4%<br />
13.7%<br />
Source: Brookings analysis of Oxford Economics data.<br />
GLOBAL CITY<br />
PROFILE:<br />
GAUTENG<br />
CITY-REGION<br />
13