

SOUTH AFRICA’S
1HAwfit
1HAwfit

You also want an ePaper? Increase the reach of your titles
YUMPU automatically turns print PDFs into web optimized ePapers that Google loves.
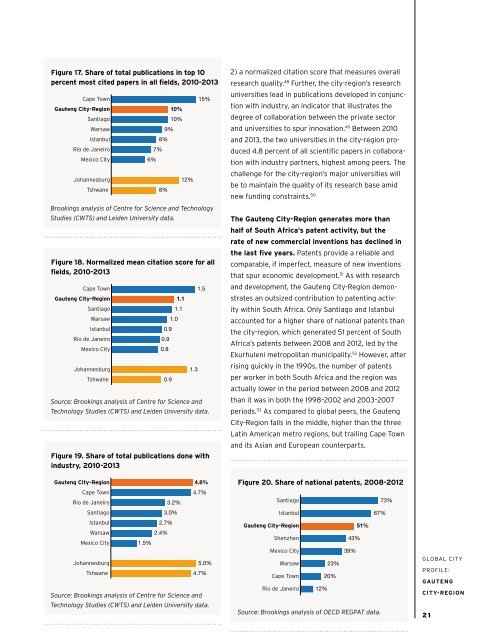
Figure 17. Share of total publications in top 10<br />
percent most cited papers in all fields, 2010-2013<br />
Cape Town<br />
Gauteng City-Region<br />
Santiago<br />
Warsaw<br />
Istanbul<br />
Rio de Janeiro<br />
Mexico City<br />
Johannesburg<br />
Tshwane<br />
6%<br />
7%<br />
8%<br />
8%<br />
9%<br />
10%<br />
10%<br />
12%<br />
15%<br />
Brookings analysis of Centre for Science and Technology<br />
Studies (CWTS) and Leiden University data.<br />
Figure 18. Normalized mean citation score for all<br />
fields, 2010-2013<br />
Cape Town<br />
Gauteng City-Region<br />
Santiago<br />
Warsaw<br />
Istanbul<br />
Rio de Janeiro<br />
Mexico City<br />
Johannesburg<br />
Tshwane<br />
0.9<br />
0.9<br />
0.8<br />
0.9<br />
1.0<br />
1.1<br />
1.1<br />
1.3<br />
Source: Brookings analysis of Centre for Science and<br />
Technology Studies (CWTS) and Leiden University data.<br />
Figure 19. Share of total publications done with<br />
industry, 2010-2013<br />
Gauteng City-Region<br />
Cape Town<br />
Rio de Janeiro<br />
Santiago<br />
Istanbul<br />
Warsaw<br />
Mexico City<br />
Johannesburg<br />
Tshwane<br />
1.5%<br />
2.7%<br />
2.4%<br />
3.2%<br />
3.0%<br />
1.5<br />
4.8%<br />
4.7%<br />
5.0%<br />
4.7%<br />
Source: Brookings analysis of Centre for Science and<br />
Technology Studies (CWTS) and Leiden University data.<br />
2) a normalized citation score that measures overall<br />
research quality. 48 Further, the city-region’s research<br />
universities lead in publications developed in conjunction<br />
with industry, an indicator that illustrates the<br />
degree of collaboration between the private sector<br />
and universities to spur innovation. 49 Between 2010<br />
and 2013, the two universities in the city-region produced<br />
4.8 percent of all scientific papers in collaboration<br />
with industry partners, highest among peers. The<br />
challenge for the city-region’s major universities will<br />
be to maintain the quality of its research base amid<br />
new funding constraints. 50<br />
The Gauteng City-Region generates more than<br />
half of South Africa’s patent activity, but the<br />
rate of new commercial inventions has declined in<br />
the last five years. Patents provide a reliable and<br />
comparable, if imperfect, measure of new inventions<br />
that spur economic development. 51 As with research<br />
and development, the Gauteng City-Region demonstrates<br />
an outsized contribution to patenting activity<br />
within South Africa. Only Santiago and Istanbul<br />
accounted for a higher share of national patents than<br />
the city-region, which generated 51 percent of South<br />
Africa’s patents between 2008 and 2012, led by the<br />
Ekurhuleni metropolitan municipality. 52 However, after<br />
rising quickly in the 1990s, the number of patents<br />
per worker in both South Africa and the region was<br />
actually lower in the period between 2008 and 2012<br />
than it was in both the 1998–2002 and 2003–2007<br />
periods. 53 As compared to global peers, the Gauteng<br />
City-Region falls in the middle, higher than the three<br />
Latin American metro regions, but trailing Cape Town<br />
and its Asian and European counterparts.<br />
Figure 20. Share of national patents, 2008-2012<br />
Santiago<br />
73%<br />
Istanbul<br />
67%<br />
Gauteng City-Region<br />
51%<br />
Shenzhen<br />
43%<br />
Mexico City<br />
39%<br />
Warsaw<br />
23%<br />
Cape Town 20%<br />
Rio de Janeiro 12%<br />
Source: Brookings analysis of OECD REGPAT data.<br />
GLOBAL CITY<br />
PROFILE:<br />
GAUTENG<br />
CITY-REGION<br />
21