

SOUTH AFRICA’S
1HAwfit
1HAwfit

You also want an ePaper? Increase the reach of your titles
YUMPU automatically turns print PDFs into web optimized ePapers that Google loves.
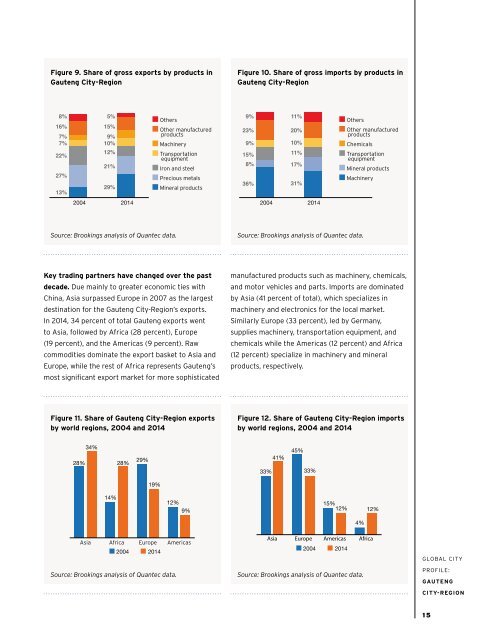
Figure 9. Share of gross exports by products in<br />
Gauteng City-Region<br />
Figure 10. Share of gross imports by products in<br />
Gauteng City-Region<br />
8%<br />
16%<br />
7%<br />
7%<br />
22%<br />
27%<br />
13%<br />
5%<br />
15%<br />
9%<br />
10%<br />
12%<br />
21%<br />
29%<br />
■ Others<br />
■ Other manufactured<br />
products<br />
■ Machinery<br />
■ Transportation<br />
equipment<br />
■ Iron and steel<br />
■ Precious metals<br />
■ Mineral products<br />
9%<br />
23%<br />
9%<br />
15%<br />
8%<br />
36%<br />
11%<br />
20%<br />
10%<br />
11%<br />
17%<br />
31%<br />
■ Others<br />
■ Other manufactured<br />
products<br />
■ Chemicals<br />
■ Transportation<br />
equipment<br />
■ Mineral products<br />
■ Machinery<br />
2004<br />
2014<br />
2004<br />
2014<br />
Source: Brookings analysis of Quantec data.<br />
Source: Brookings analysis of Quantec data.<br />
Key trading partners have changed over the past<br />
decade. Due mainly to greater economic ties with<br />
China, Asia surpassed Europe in 2007 as the largest<br />
destination for the Gauteng City-Region’s exports.<br />
In 2014, 34 percent of total Gauteng exports went<br />
to Asia, followed by Africa (28 percent), Europe<br />
(19 percent), and the Americas (9 percent). Raw<br />
commodities dominate the export basket to Asia and<br />
Europe, while the rest of Africa represents Gauteng’s<br />
most significant export market for more sophisticated<br />
manufactured products such as machinery, chemicals,<br />
and motor vehicles and parts. Imports are dominated<br />
by Asia (41 percent of total), which specializes in<br />
machinery and electronics for the local market.<br />
Similarly Europe (33 percent), led by Germany,<br />
supplies machinery, transportation equipment, and<br />
chemicals while the Americas (12 percent) and Africa<br />
(12 percent) specialize in machinery and mineral<br />
products, respectively.<br />
Figure 11. Share of Gauteng City-Region exports<br />
by world regions, 2004 and 2014<br />
Figure 12. Share of Gauteng City-Region imports<br />
by world regions, 2004 and 2014<br />
28%<br />
34%<br />
33%<br />
41%<br />
45%<br />
33%<br />
28% 29% 19%<br />
14%<br />
12%<br />
9%<br />
12%<br />
15%<br />
12%<br />
4%<br />
Asia Africa Europe Americas<br />
■ 2004 ■ 2014<br />
Source: Brookings analysis of Quantec data.<br />
Asia Europe Americas Africa<br />
■ 2004 ■ 2014<br />
Source: Brookings analysis of Quantec data.<br />
GLOBAL CITY<br />
PROFILE:<br />
GAUTENG<br />
CITY-REGION<br />
15