

SOUTH AFRICA’S
1HAwfit
1HAwfit

Create successful ePaper yourself
Turn your PDF publications into a flip-book with our unique Google optimized e-Paper software.
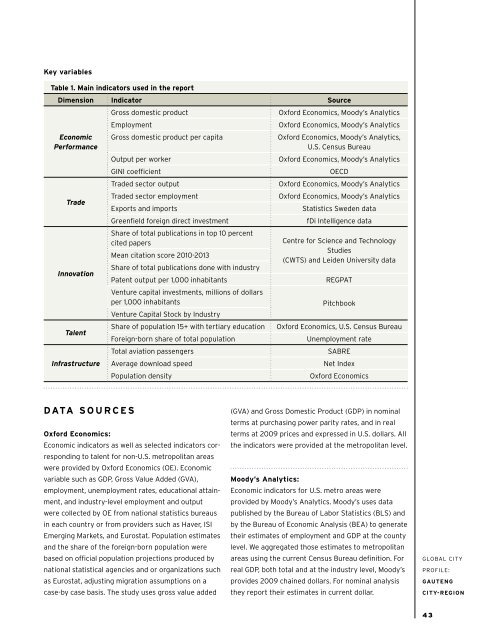
Key variables<br />
Table 1. Main indicators used in the report<br />
Dimension Indicator Source<br />
Economic<br />
Performance<br />
Trade<br />
Innovation<br />
Talent<br />
Infrastructure<br />
Gross domestic product<br />
Employment<br />
Gross domestic product per capita<br />
Output per worker<br />
GINI coefficient<br />
Traded sector output<br />
Traded sector employment<br />
Exports and imports<br />
Greenfield foreign direct investment<br />
Share of total publications in top 10 percent<br />
cited papers<br />
Mean citation score 2010-2013<br />
Share of total publications done with industry<br />
Patent output per 1,000 inhabitants<br />
Venture capital investments, millions of dollars<br />
per 1,000 inhabitants<br />
Venture Capital Stock by Industry<br />
Share of population 15+ with tertiary education<br />
Foreign-born share of total population<br />
Total aviation passengers<br />
Average download speed<br />
Population density<br />
Oxford Economics, Moody’s Analytics<br />
Oxford Economics, Moody’s Analytics<br />
Oxford Economics, Moody’s Analytics,<br />
U.S. Census Bureau<br />
Oxford Economics, Moody’s Analytics<br />
OECD<br />
Oxford Economics, Moody’s Analytics<br />
Oxford Economics, Moody’s Analytics<br />
Statistics Sweden data<br />
fDi Intelligence data<br />
Centre for Science and Technology<br />
Studies<br />
(CWTS) and Leiden University data<br />
REGPAT<br />
Pitchbook<br />
Oxford Economics, U.S. Census Bureau<br />
Unemployment rate<br />
SABRE<br />
Net Index<br />
Oxford Economics<br />
DATA SOURCES<br />
Oxford Economics:<br />
Economic indicators as well as selected indicators corresponding<br />
to talent for non-U.S. metropolitan areas<br />
were provided by Oxford Economics (OE). Economic<br />
variable such as GDP, Gross Value Added (GVA),<br />
employment, unemployment rates, educational attainment,<br />
and industry-level employment and output<br />
were collected by OE from national statistics bureaus<br />
in each country or from providers such as Haver, ISI<br />
Emerging Markets, and Eurostat. Population estimates<br />
and the share of the foreign-born population were<br />
based on official population projections produced by<br />
national statistical agencies and or organizations such<br />
as Eurostat, adjusting migration assumptions on a<br />
case-by case basis. The study uses gross value added<br />
(GVA) and Gross Domestic Product (GDP) in nominal<br />
terms at purchasing power parity rates, and in real<br />
terms at 2009 prices and expressed in U.S. dollars. All<br />
the indicators were provided at the metropolitan level.<br />
Moody’s Analytics:<br />
Economic indicators for U.S. metro areas were<br />
provided by Moody’s Analytics. Moody’s uses data<br />
published by the Bureau of Labor Statistics (BLS) and<br />
by the Bureau of Economic Analysis (BEA) to generate<br />
their estimates of employment and GDP at the county<br />
level. We aggregated those estimates to metropolitan<br />
areas using the current Census Bureau definition. For<br />
real GDP, both total and at the industry level, Moody’s<br />
provides 2009 chained dollars. For nominal analysis<br />
they report their estimates in current dollar.<br />
GLOBAL CITY<br />
PROFILE:<br />
GAUTENG<br />
CITY-REGION<br />
43