FOR PEOPLE
1ONa2xt
1ONa2xt

You also want an ePaper? Increase the reach of your titles
YUMPU automatically turns print PDFs into web optimized ePapers that Google loves.
Percent Share of Average<br />
Annual Expenditures<br />
35%<br />
30%<br />
25%<br />
20%<br />
15%<br />
10%<br />
5%<br />
both renters 0% and owners for in some In each of these markets there have<br />
peripheral areas as well such as the past been strong increases (income adjusted)<br />
decade. 8 Overall, US housing production relative to historic averages. In New<br />
dropped not Housing only since Life the Insurance, 2007 Health Care York, Entertainment rents increased between 2010 and<br />
Tansportation Pension Savings, Apparel, Other Charitable Contributions<br />
recession, but also by almost<br />
Social Security<br />
Food & Alcohol a quarter Products & Services 2015 Education by 50 percent, while incomes for<br />
Source: between “The Evolving 2011 Expenditures and of 2015. U.S. Households,” Production Townhall Finance, has March 26, 2015, http://finance.townhall.com/-<br />
renters between ages 25 and 44 grew by<br />
columnists/politicalcalculations/2015/03/26/the-evolving-expenditures-of-us-households-n1976354/page/full<br />
fallen so far that one Texas metropolitan just eight percent. 13<br />
area, Houston, produced nearly as many These high costs particularly<br />
new single-family homes in 2014 as the impact young families, especially<br />
entire state of California. 9<br />
those with school age children. Indeed,<br />
Middle-Income These high housing Housing prices particulaly Affordability metropolitan areas with the highest<br />
boost rents, largely by forcing potential prices relative to incomes (the highest<br />
MAJOR US METROPOLITAN AREAS: 1950-2014 Figure 2<br />
buyers into the apartment market. Rental median multiples)—New York, Los<br />
costs<br />
10<br />
now comprise the largest share of Angeles, the San Francisco Bay Area,<br />
Less Restrictive Markets<br />
income 9 in modern US history. In part, Miami, Seattle and Portland, for<br />
More Restrictive Markets: Outside California<br />
this is due to California a still-weak (All More Restricted economy Markets)<br />
8<br />
that example—generally have a lower<br />
is generating 7 little in the way of income percentage of school age children. In<br />
gains. 6<br />
10 Since 1990, renters' income has contrast, family formation is strongest<br />
been 5 stagnant, but inflation adjusted in areas with more favorable housing<br />
rents 4 have soared 14.7 percent. 11<br />
affordability. This also includes areas<br />
3This situation is most severe in the within large metropolitan areas, for<br />
highest-priced 2 markets. In New York, example, San Bernardino-Riverside<br />
Los 1Angeles, Miami and San Francisco, outside of Los Angeles, or Pierce County<br />
for 0example, renters spend 40 percent (Tacoma) south of Seattle.<br />
of their 1950 income 1960 on rent, 1970 well above 1980 1985 the 1990 1995 2000 Young, 2005 2010 first-time buyers who, unlike<br />
national average of under 30 percent. 12 older buyers, have not benefited from<br />
Median Multiple<br />
1985<br />
1990<br />
Source: Census Bureau, Harvard University and Demographia.<br />
1995<br />
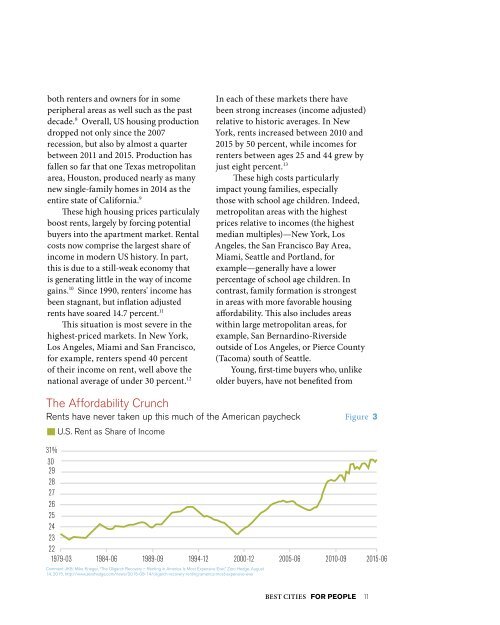
The Affordability Crunch<br />
Rents have never taken up this much of the American paycheck<br />
U.S. Rent as Share of Income<br />
31%<br />
30<br />
29<br />
28<br />
27<br />
26<br />
25<br />
24<br />
23<br />
22<br />
1979-03<br />
1984-06<br />
2000<br />
2005<br />
2010<br />
1989-09 1994-12 2000-12 2005-06 2010-09 2015-06<br />
Comment JK8: Mike Krieger, “The Oligarch Recovery – Renting in America Is Most Expensive Ever,” Zero Hedge, August<br />
14, 2015, http://www.zerohedge.com/news/2015-08-14/oligarch-recovery-renting-america-most-expensive-ever<br />
Figure 5<br />
Under Age 35 Home Ownership<br />
UNITED STATES: 2000-2014<br />
Figure 3<br />
BEST CITIES <strong>FOR</strong> <strong>PEOPLE</strong> 11<br />
60%<br />
50%<br />
40%<br />
30%<br />
20%<br />
10%<br />
0%<br />
Los Angele<br />
From: Zillow<br />
Figure 4<br />
Impact of<br />
Housing A<br />
52 Major Metr<br />
Ages 5-17 Share<br />
of Population<br />
14%<br />
12%<br />
10%<br />
8%<br />
6%<br />
4%<br />
2%<br />
0%<br />
Hou<br />
Derived from Census<br />
Figure 6<br />
Constructi<br />
San Francisco<br />
Compared to Detached (5)<br />
8<br />
7<br />
6<br />
5<br />
4<br />
3<br />
2<br />
1<br />
0<br />
Detached<br />
(5 per Acre)<br />
Derived from FBI Sta<br />
Figure 7<br />
Age 5-14 P<br />
52 Major Metro<br />
16%