FOR PEOPLE
1ONa2xt
1ONa2xt

You also want an ePaper? Increase the reach of your titles
YUMPU automatically turns print PDFs into web optimized ePapers that Google loves.
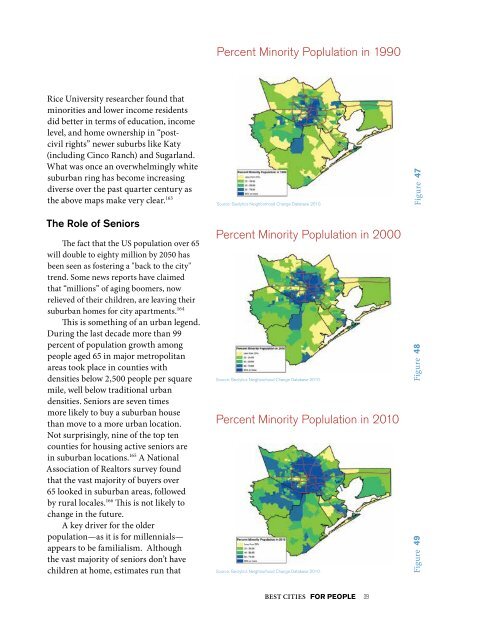
Percent Minority Poplulation in 1990<br />
Rice University researcher found that<br />
minorities and lower income residents<br />
did better in terms of education, income<br />
level, and home ownership in “postcivil<br />
rights” newer suburbs like Katy<br />
(including Cinco Ranch) and Sugarland.<br />
What was once an overwhelmingly white<br />
suburban ring has become increasing<br />
diverse over the past quarter century as<br />
the above maps make very clear. 163<br />
The Role of Seniors<br />
The fact that the US population over 65<br />
will double to eighty million by 2050 has<br />
been seen as fostering a "back to the city"<br />
trend. Some news reports have claimed<br />
that “millions” of aging boomers, now<br />
relieved of their children, are leaving their<br />
suburban homes for city apartments. 164<br />
This is something of an urban legend.<br />
During the last decade more than 99<br />
percent of population growth among<br />
people aged 65 in major metropolitan<br />
areas took place in counties with<br />
densities below 2,500 people per square<br />
mile, well below traditional urban<br />
densities. Seniors are seven times<br />
more likely to buy a suburban house<br />
than move to a more urban location.<br />
Not surprisingly, nine of the top ten<br />
counties for housing active seniors are<br />
in suburban locations. 165 A National<br />
Association of Realtors survey found<br />
that the vast majority of buyers over<br />
65 looked in suburban areas, followed<br />
by rural locales. 166 This is not likely to<br />
change in the future.<br />
A key driver for the older<br />
population—as it is for millennials—<br />
appears to be familialism. Although<br />
the vast majority of seniors don’t have<br />
children at home, estimates run that<br />
Source: Geolytics Neighborhood Change Database 2010.<br />
Source: Geolytics Neighborhood Change Database 2010.<br />
Source: Geolytics Neighborhood Change Database 2010.<br />
Percent Minority Poplulation in 2000<br />
Percent Minority Poplulation in 2000<br />
Source: Geolytics Neighborhood Change Database 2010.<br />
Source: Geolytics Neighborhood Change Database 2010.<br />
Percent Minority Poplulation in 2010<br />
Source: Geolytics Neighborhood Change Database 2010.<br />
Percent Minority Poplulation in 2010<br />
Source: Geolytics Neighborhood Change Database 2010.<br />
Source: Geolytics Neighborhood Change Database 2010.<br />
Figure 47<br />
Figure 47 47<br />
9<br />
Figure 48<br />
Figure 48 48<br />
Figure 49 49<br />
BEST CITIES <strong>FOR</strong> <strong>PEOPLE</strong> 39