FOR PEOPLE
1ONa2xt
1ONa2xt

You also want an ePaper? Increase the reach of your titles
YUMPU automatically turns print PDFs into web optimized ePapers that Google loves.
(3.1-4.0) (4.1-5.0) (5.1-& Over)<br />
Housing Affordability Category: Median Multiple<br />
Derived from Census Bureau and Demographia.<br />
5 2010<br />
of young, middle-income families with<br />
can paycheck Figure 3<br />
children. To measure the impact of<br />
density and urban form, we use the City<br />
Sector model, originally developed by<br />
groundbreaking research published by<br />
David L. A. Gordon and Mark Janzen at<br />
Queen's University in Kingston Ontario. 20<br />
The City Sector Model classifies<br />
all metropolitan zip code areas on a<br />
continuum from the dense urban cores<br />
that preceded World War II, through older<br />
and newer suburban areas and exurban<br />
areas outside the continuous urbanization.<br />
The City Sector Model gives a much more<br />
-12 2005-06 accurate representation 2010-09 2015-06 of urban core<br />
versus suburban development because<br />
many core cities include substantial areas<br />
of suburban development. The criteria for<br />
classification can be seen in the footnote. 21<br />
Overall, the highest density major<br />
metropolitan areas have far smaller<br />
percentages of school age children. In<br />
the dense, urban core Central Business<br />
Districts (CBDs), the percentage of five<br />
to fourteen year-olds is less than one-half<br />
that of less dense, more peripheral areas.<br />
Generally speaking, families are most<br />
prevalent in newer suburbs and exurbs,<br />
those built largely since the 1970s, than<br />
in older suburbs, while the inner core<br />
areas, some dating from the late 19th and<br />
early 20th Century, have the lowest.<br />
The highest percentage of US<br />
2014<br />
women over age 40 without children<br />
can be found in expensive and dense<br />
Washington, DC: a remarkable 70<br />
percent. In Manhattan, singles comprise<br />
half of all households. 22 In some central<br />
neighborhoods of major metropolitan<br />
areas such as New York and Seattle, less<br />
than 10 percent of the population is<br />
made up of children under 18. According<br />
to Census figures, in 2011, children<br />
ge, August<br />
-ever<br />
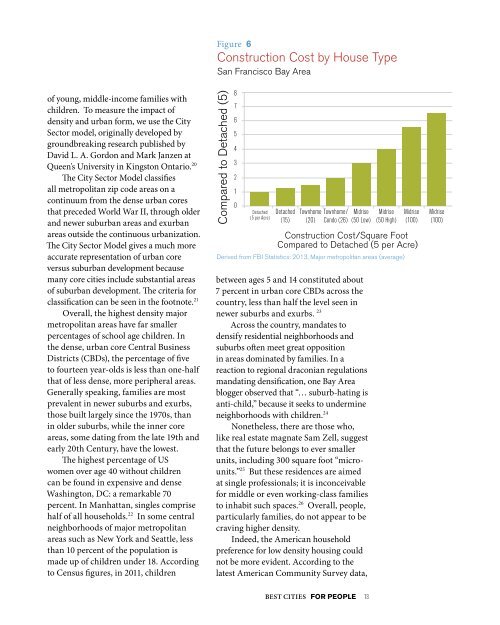
Figure 6<br />
Construction Cost by House Type<br />
San Francisco Bay Area<br />
Compared to Detached (5)<br />
8<br />
7<br />
6<br />
5<br />
4<br />
3<br />
2<br />
1<br />
0<br />
Detached<br />
(5 per Acre)<br />
Detached<br />
(15)<br />
Townhome Townhome/<br />
(20) Condo (26)<br />
Midrise<br />
(50 Low)<br />
Midrise<br />
(50 High)<br />
Figure between 7ages 5 and 14 constituted about<br />
7 percent in urban core CBDs across the<br />
country, less than half the level seen in<br />
52 Major Metropolitan Areas: 2010<br />
newer suburbs and exurbs. 23<br />
16% Across the country, mandates to 15.0%<br />
14.2%<br />
densify 14% residential neighborhoods 13% and<br />
suburbs 12% often meet 11.6% great opposition<br />
in areas dominated by families. In a<br />
10%<br />
reaction to regional draconian regulations<br />
mandating 8% densification, one Bay Area<br />
blogger 6% observed 5.3% that “… suburb-hating is<br />
anti-child,” 4% because it seeks to undermine<br />
neighborhoods with children. 24<br />
2%<br />
Nonetheless, there are those who,<br />
like 0% real estate magnate Sam Zell, suggest<br />
Urban Core: Urban Core:<br />
CBD Inner Ring<br />
that the future belongs to ever smaller<br />
units, including Small 300 Areas square (Zip foot Code “microunits.”<br />
25 But these residences are aimed<br />
Analysis Zones)<br />
at single professionals; it is inconceivable<br />
for middle or even working-class families<br />
to inhabit such spaces. 26 Overall, people,<br />
particularly families, do not appear to be<br />
craving higher density.<br />
Indeed, the American household<br />
preference for low density housing could<br />
not be more evident. According to the<br />
latest American Community Survey data,<br />
Midrise<br />
(100)<br />
Construction Cost/Square Foot<br />
Compared to Detached (5 per Acre)<br />
Derived from FBI Statistics: 2013, Major metropolitan areas (average)<br />
Age 5-14 Population % by Urban Sector<br />
13.5%<br />
Early Suburb Later Suburb Exurb OVERALL<br />
Midrise<br />
(100)<br />
BEST CITIES <strong>FOR</strong> <strong>PEOPLE</strong> 13