FOR PEOPLE
1ONa2xt
1ONa2xt

Create successful ePaper yourself
Turn your PDF publications into a flip-book with our unique Google optimized e-Paper software.
0%<br />
Urban Core:<br />
CBD<br />
Urban Core:<br />
Inner Ring<br />
Earlier Suburb Later Suburb Exurb<br />
Small Areas (Zip Code Tabulation Areas)<br />
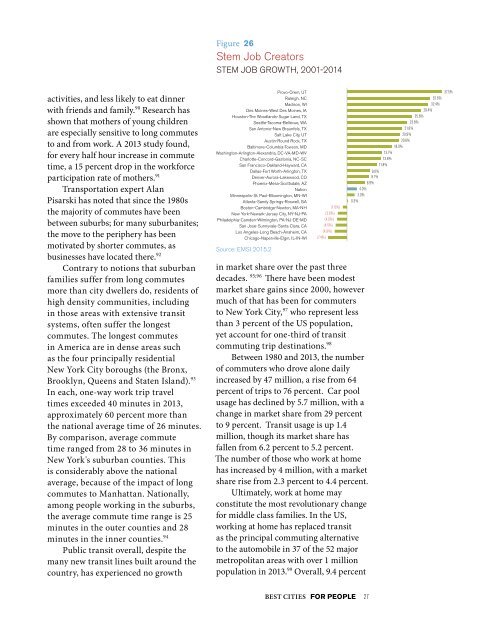
Figure 26<br />
Stem Job Creators<br />
STEM JOB GROWTH, 2001-2014<br />
activities, and less likely to eat dinner<br />
with friends and family. 90 Research has<br />
shown that mothers of young children<br />
are especially sensitive to long commutes<br />
to and from work. A 2013 study found,<br />
for every half hour increase in commute<br />
time, a 15 percent drop in the workforce<br />
participation rate of mothers. 91<br />
Transportation expert Alan<br />
Pisarski has noted that since the 1980s<br />
the majority of commutes have been<br />
between suburbs; for many suburbanites;<br />
the move to the periphery has been<br />
motivated by shorter commutes, as<br />
businesses have located there. 92<br />
Contrary to notions that suburban<br />
families suffer from long commutes<br />
more than city dwellers do, residents of<br />
high density communities, including<br />
in those areas with extensive transit<br />
systems, often suffer the longest<br />
commutes. The longest commutes<br />
in America are in dense areas such<br />
as the four principally residential<br />
New York City boroughs (the Bronx,<br />
Brooklyn, Queens and Staten Island). 93<br />
In each, one-way work trip travel<br />
times exceeded 40 minutes in 2013,<br />
approximately 60 percent more than<br />
the national average time of 26 minutes.<br />
By comparison, average commute<br />
time ranged from 28 to 36 minutes in<br />
New York's suburban counties. This<br />
is considerably above the national<br />
average, because of the impact of long<br />
commutes to Manhattan. Nationally,<br />
among people working in the suburbs,<br />
the average commute time range is 25<br />
minutes in the outer counties and 28<br />
minutes in the inner counties. 94<br />
Public transit overall, despite the<br />
many new transit lines built around the<br />
country, has experienced no growth<br />
Provo-Orem, UT<br />
Raleigh, NC<br />
Madison, WI<br />
Des Moines-West Des Moines, IA<br />
Houston-The Woodlands-Sugar Land, TX<br />
Seattle-Tacoma-Bellevue, WA<br />
San Antonio-New Braunfels, TX<br />
Salt Lake City, UT<br />
Austin-Round Rock, TX<br />
Baltimore-Columbia-Towson, MD<br />
Washington-Arlington-Alexandria, DC-VA-MD-WV<br />
Charlotte-Concord-Gastonia, NC-SC<br />
San Francisco-Oakland-Hayward, CA<br />
Dallas-Fort Worth-Arlington, TX<br />
Denver-Aurora-Lakewood, CO<br />
Phoenix-Mesa-Scottsdale, AZ<br />
Nation<br />
Minneapolis-St. Paul-Bloomington, MN-WI<br />
Atlanta-Sandy Springs-Roswell, GA<br />
Boston-Cambridge-Newton, MA-NH<br />
(1.6%)<br />
New York-Newark-Jersey City, NY-NJ-PA (3.6%)<br />
Philadelphia-Camden-Wilmington, PA-NJ-DE-MD (4.0%)<br />
San Jose-Sunnyvale-Santa Clara, CA (4.5%)<br />
Los Angeles-Long Beach-Anaheim, CA (4.9%)<br />
Chicago-Naperville-Elgin, IL-IN-WI (7.4%)<br />
Source: EMSI 2015.2<br />
One-Way Work Trip Market Share<br />
37.5%<br />
32.6%<br />
32.4%<br />
29.4%<br />
25.8%<br />
23.8%<br />
21.6%<br />
20.9%<br />
20.6%<br />
18.0%<br />
13.7%<br />
13.6%<br />
11.8%<br />
9.0%<br />
8.7%<br />
6.9%<br />
4.0%<br />
3.0%<br />
0.3%<br />
in market share over the past three<br />
decades. 95;96 There have been modest<br />
UNITED STATES: 1980-2013<br />
market share gains since 2000, however<br />
much of that has been for commuters<br />
to New York City, 97 who represent less<br />
80%<br />
than 3 percent of the US population,<br />
70%<br />
yet account for one-third of transit<br />
60%<br />
commuting trip destinations. 98<br />
Between 50% 1980 and 2013, the number<br />
of commuters 40% who drove alone daily<br />
increased 30% by 47 million, a rise from 64<br />
percent of trips to 76 percent. Car pool<br />
20%<br />
usage has declined by 5.7 million, with a<br />
10%<br />
change in market share from 29 percent<br />
0%<br />
to 9 percent. Transit usage is up 1.4<br />
million, though its market share has<br />
fallen from 6.2 percent to 5.2 percent.<br />
Market Share for Indicated Years Only<br />
Derived Census Burea data<br />
The number of those who work at home<br />
has increased by 4 million, with a market<br />
share rise from 2.3 percent to 4.4 percent.<br />
Ultimately, work at home may<br />
constitute the most revolutionary change<br />
for middle class families. In the US,<br />
working at home has replaced transit<br />
as the principal commuting alternative<br />
to the automobile in 37 of the 52 major<br />
metropolitan areas with over 1 million<br />
population in 2013. 99 Overall, 9.4 percent<br />
Market Share<br />
1980 1990 2000<br />
BEST CITIES <strong>FOR</strong> <strong>PEOPLE</strong> 27