FOR PEOPLE
1ONa2xt
1ONa2xt
Create successful ePaper yourself
Turn your PDF publications into a flip-book with our unique Google optimized e-Paper software.
Urban Core:<br />
CBD<br />
Urban Core:<br />
Inner Ring<br />
Early Suburb Later Suburb Exurb<br />
Small Area (Zip Code Analysis Zones)<br />
Detached<br />
House<br />
80.0%<br />
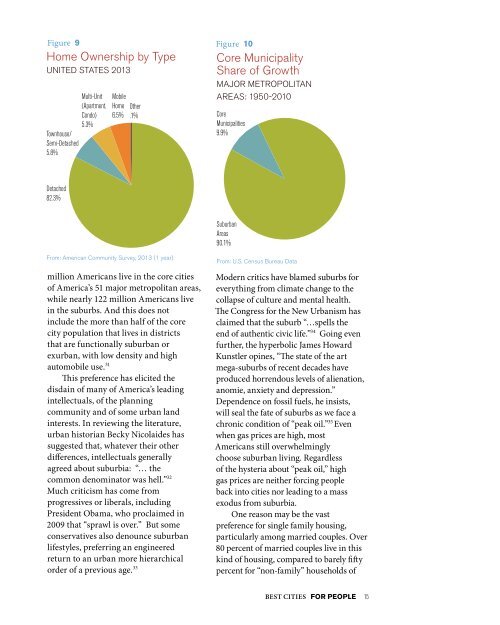
Figure 9<br />
Home Ownership by Type<br />
UNITED STATES 2013<br />
0K + Municipalities<br />
in 2013<br />
Multi-Unit<br />
(Apartment,<br />
Condo)<br />
5.3%<br />
Townhouse/<br />
Semi-Detached<br />
5.8%<br />
Mobile<br />
Home<br />
6.5%<br />
Other<br />
.1%<br />
Figure 10<br />
Core Municipality<br />
Share of Growth<br />
MAJOR METROPOLITAN<br />
AREAS: 1950-2010<br />
Core<br />
Municipalities<br />
9.9%<br />
Figure 12<br />
Housing by Family Type<br />
U.S. 2013<br />
100%<br />
80%<br />
Other<br />
Multi Family<br />
Single Family<br />
Detached<br />
82.3%<br />
60%<br />
Portland<br />
New<br />
York<br />
13, 1 year<br />
Baltimore<br />
Denver<br />
Richmond<br />
San Diego<br />
From: American Community Survey, 2013 (1 year)<br />
million Americans live in the core cities<br />
of America’s 51 major metropolitan areas,<br />
n Sectorwhile nearly 122 million Americans live<br />
in the suburbs. And this does not<br />
include the more than half of the core<br />
city population that lives in districts<br />
that are functionally suburban or<br />
exurban, with low density and high<br />
automobile use. 31<br />
This preference has elicited the<br />
disdain of many of America’s leading<br />
intellectuals, of the planning<br />
community and of some urban land<br />
interests. In reviewing the literature,<br />
urban historian Becky Nicolaides has<br />
suggested that, whatever their other<br />
differences, intellectuals generally<br />
burb Later Suburb Exurb<br />
agreed about suburbia: “… the<br />
e Analysis Zones) common denominator was hell.” 32<br />
Much criticism has come from<br />
progressives or liberals, including<br />
President Obama, who proclaimed in<br />
Type<br />
2009 that “sprawl is over.” But some<br />
conservatives also denounce suburban<br />
lifestyles, preferring an engineered<br />
return to an urban more hierarchical<br />
order of a previous age. 33<br />
Suburban<br />
Areas<br />
90.1%<br />
From: U.S. Census Bureau Data<br />
Modern Figure 11 critics have blamed suburbs for<br />
everything Housing from Preferences:<br />
climate change to the<br />
collapse<br />
Realtors<br />
of culture<br />
Survey<br />
and mental health.<br />
The Congress for the New Urbanism has<br />
2011 COMMUNITY<br />
claimed that the suburb “…spells the<br />
PREFERENCE SURVEY<br />
end of authentic civic life.” 34 Going even<br />
Other<br />
further, the hyperbolic Multi-Unit<br />
5.0%<br />
James Howard<br />
Kunstler opines, “The 8.0% state of the Attached art<br />
mega-suburbs of recent decades Single have family<br />
7.0%<br />
produced horrendous levels of alienation,<br />
anomie, anxiety and depression.”<br />
Dependence on fossil fuels, he insists,<br />
will seal the fate of suburbs as we face a<br />
chronic condition of “peak oil.” 35 Even<br />
when gas prices are high, most<br />
Americans still overwhelmingly<br />
choose suburban living. Regardless<br />
of Detached the hysteria about “peak oil,” high<br />
House<br />
gas prices are neither forcing people<br />
80.0%<br />
back into cities nor leading to a mass<br />
exodus from suburbia.<br />
Figure One 12reason may be the vast<br />
Housing preference for by single Family family Type housing,<br />
U.S. particularly 2013 among married couples. Over<br />
80 percent of married couples live in this<br />
Other Multi Family Single Family<br />
100% kind of housing, compared to barely fifty<br />
percent for “non-family” households of<br />
40%<br />
20%<br />
0%<br />
Married<br />
Couples<br />
Single Head<br />
of Household<br />
Non Family<br />
Household<br />
From: Derived from American Community Survey 2013<br />
(One Year)<br />
80%<br />
BEST CITIES <strong>FOR</strong> <strong>PEOPLE</strong> 15


