FOR PEOPLE
1ONa2xt
1ONa2xt

Create successful ePaper yourself
Turn your PDF publications into a flip-book with our unique Google optimized e-Paper software.
This will likely grow in the future,<br />
given millennial attitudes towards<br />
family. While they hold some very liberal<br />
social views, they often have surprisingly<br />
traditional attitudes towards teenage<br />
sex, abortion, and the desirability of<br />
marriage. 137 Rather than being committed<br />
to perpetual singlehood, a Pew study<br />
found that a majority of American<br />
millennials ranked being “good parents”<br />
as their highest priority, followed by a<br />
third who identified having a successful<br />
marriage as most important. In contrast,<br />
having a “high paying career” was named<br />
by 15 percent. 138, 139 The latest Monitoring<br />
the Future report found that 78 percent of<br />
female high school seniors and 70 percent<br />
of males say that having a good marriage<br />
and family life is “extremely important”<br />
to them—numbers that are virtually<br />
unchanged since the 1970s. 140<br />
Millennials may be staying in the<br />
city longer than previous generations did<br />
partly due to economic pressures that<br />
have made changing locations or buying<br />
141; 142<br />
a house very difficult.<br />
But by 2018, when the peak of<br />
the millennial population turns<br />
30, suggests economist Kolko, the<br />
demand for suburban houses is likely<br />
to increase dramatically. 143 Faced with<br />
a huge student debt load, a weaker job<br />
market, and often high housing prices,<br />
millennials face tougher challenges than<br />
some previous generations, but retain<br />
remarkably similar aspirations. 144<br />
Newcomers to the Dream<br />
America’s changing demographics<br />
will also contribute to growing<br />
demands for family-oriented housing<br />
and communities. According to the<br />
Source: Figure Frank 39 N. Magid 0% Associates 10% 20% 30% 40% 50%<br />
Source: Frank N. Magid Associates<br />
Figure US 20-27 36 Year Olds<br />
vs. 28-35 Year Old<br />
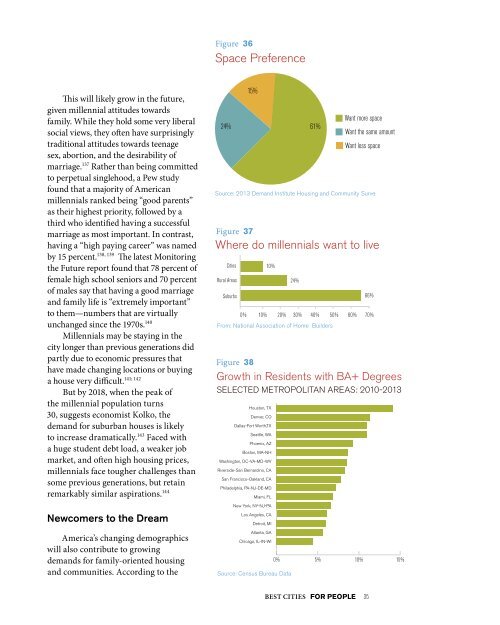
Figure Space 36Preference<br />
42<br />
Space 41 Preference<br />
40<br />
39<br />
38<br />
37<br />
15%<br />
35 24% 61%<br />
Want more the same space amount<br />
Want the less same spaceamount<br />
Want less space<br />
From: Business Insider/Andy Kiersz, data from US Census Bureau<br />
Source: 2013 Demand Institute Housing and Community Surve<br />
Source: 2013 Demand Institute Housing and Community Surve<br />
Where Figure 20 37do millennials want to live<br />
15<br />
Where do millennials want to live<br />
Rural 5<br />
Cities Areas<br />
0<br />
Rural Suburbs Areas<br />
15%<br />
24% 61%<br />
36<br />
34<br />
2014<br />
Figure 37<br />
10Cities<br />
10%<br />
10%<br />
24%<br />
24%<br />
Want more space<br />
2016<br />
2018<br />
2020<br />
2022<br />
2024<br />
2026<br />
2028<br />
2030<br />
2032<br />
2034<br />
2036<br />
2038<br />
2040<br />
2042<br />
2044<br />
2046<br />
2048<br />
2050<br />
2052<br />
2054<br />
2056<br />
2058<br />
2060<br />
Figure 40<br />
Percent Living in Urban<br />
Neighborhoods, By Age Group<br />
35<br />
30<br />
25<br />
18-21<br />
22-24<br />
25-29<br />
30-34<br />
35-39<br />
40-44<br />
66%<br />
45-49<br />
50-54<br />
55-59<br />
60-64<br />
65-59<br />
70-74<br />
Suburbs<br />
66%<br />
0% 10% 20% 30% 40% 50% 60% 70%<br />
From: National Association of Home Builders<br />
0% 10% 20% 30% 40% 50% 60% 70%<br />
From: National Association of Home Builders<br />
75-79<br />
80-84<br />
85+<br />
Figure 38<br />
Growth in Residents with BA+ Degrees<br />
SELECTED METROPOLITAN AREAS: 2010-2013<br />
Houston, TX<br />
Denver, CO<br />
Dallas-Fort Worth,TX<br />
Seattle, WA<br />
Phoenix, AZ<br />
Boston, MA-NH<br />
Washington, DC-VA-MD-WV<br />
Riverside-San Bernardino, CA<br />
San Francisco-Oakland, CA<br />
Philadelphia, PA-NJ-DE-MD<br />
Miami, FL<br />
New York, NY-NJ-PA<br />
Los Angeles, CA<br />
Detroit, MI<br />
Atlanta, GA<br />
Chicago, IL-IN-WI<br />
Source: Census Bureau Data<br />
0% 5% 10% 15%<br />
BEST CITIES <strong>FOR</strong> <strong>PEOPLE</strong> 35