FOR PEOPLE
1ONa2xt
1ONa2xt

Create successful ePaper yourself
Turn your PDF publications into a flip-book with our unique Google optimized e-Paper software.
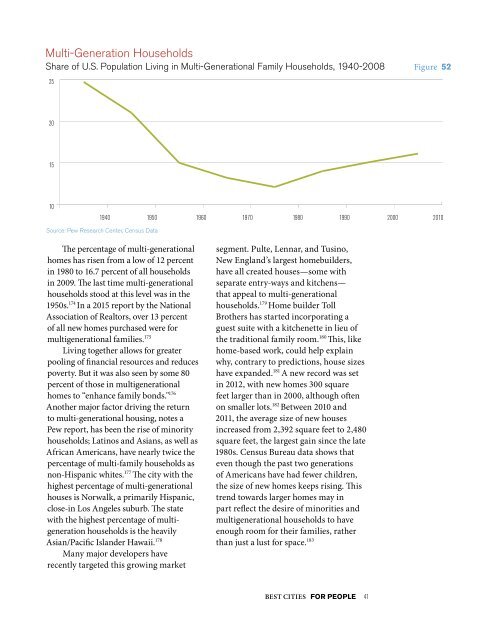
Multi-Generation Households<br />
Share of U.S. Population Living in Multi-Generational Family Households, 1940-2008 Figure 52<br />
25<br />
20<br />
15<br />
10<br />
1940 1950 1960 1970 1980 1990 2000 2010<br />
Source: Pew Research Center, Census Data<br />
The percentage of multi-generational<br />
homes has risen from a low of 12 percent<br />
in 1980 to 16.7 percent of all households<br />
in 2009. The last time multi-generational<br />
households stood at this level was in the<br />
1950s. 174 In a 2015 report by the National<br />
Association of Realtors, over 13 percent<br />
of all new homes purchased were for<br />
multigenerational families. 175<br />
Living together allows for greater<br />
pooling of financial resources and reduces<br />
poverty. But it was also seen by some 80<br />
percent of those in multigenerational<br />
homes to “enhance family bonds." 176<br />
Another major factor driving the return<br />
to multi-generational housing, notes a<br />
Pew report, has been the rise of minority<br />
households; Latinos and Asians, as well as<br />
African Americans, have nearly twice the<br />
percentage of multi-family households as<br />
non-Hispanic whites. 177 The city with the<br />
highest percentage of multi-generational<br />
houses is Norwalk, a primarily Hispanic,<br />
close-in Los Angeles suburb. The state<br />
with the highest percentage of multigeneration<br />
households is the heavily<br />
Asian/Pacific Islander Hawaii. 178<br />
Many major developers have<br />
recently targeted this growing market<br />
segment. Pulte, Lennar, and Tusino,<br />
New England’s largest homebuilders,<br />
have all created houses—some with<br />
separate entry-ways and kitchens—<br />
that appeal to multi-generational<br />
households. 179 Home builder Toll<br />
Brothers has started incorporating a<br />
guest suite with a kitchenette in lieu of<br />
the traditional family room. 180 This, like<br />
home-based work, could help explain<br />
why, contrary to predictions, house sizes<br />
have expanded. 181 A new record was set<br />
in 2012, with new homes 300 square<br />
feet larger than in 2000, although often<br />
on smaller lots. 182 Between 2010 and<br />
2011, the average size of new houses<br />
increased from 2,392 square feet to 2,480<br />
square feet, the largest gain since the late<br />
1980s. Census Bureau data shows that<br />
even though the past two generations<br />
of Americans have had fewer children,<br />
the size of new homes keeps rising. This<br />
trend towards larger homes may in<br />
part reflect the desire of minorities and<br />
multigenerational households to have<br />
enough room for their families, rather<br />
than just a lust for space. 183<br />
Home Ownersh<br />
UNITED STATES: 20<br />
80%<br />
70%<br />
60%<br />
50%<br />
40%<br />
30%<br />
20%<br />
10%<br />
0%<br />
1900<br />
1910<br />
From: Census Bureau<br />
1920 1930<br />
BEST CITIES <strong>FOR</strong> <strong>PEOPLE</strong> 41