FOR PEOPLE
1ONa2xt
1ONa2xt

Create successful ePaper yourself
Turn your PDF publications into a flip-book with our unique Google optimized e-Paper software.
Figure 21<br />
Inequality Levels Across Nation’s Largest Cities<br />
(highest)<br />
areas with more than 1 million in<br />
population, notes demographer Wendell<br />
Cox, suburban areas were less unequal<br />
(measured by the Gini coefficient) than<br />
the core cities in 46 cases. 76<br />
This reflects the fact that most of the<br />
middle class economy is found outside<br />
the dense, core cities. The monocentric<br />
city, where all activity revolves around<br />
a vital urban core may represent “… the<br />
rhetorical framework for urban policy<br />
discussion everywhere” but increasingly<br />
does not reflect reality, notes author<br />
William Bogart. 78 Today, large suburbs<br />
are often the new job centers. 79 Some—<br />
Irvine, and Santa Clara, California;<br />
Bellevue, outside Seattle; and Irving,<br />
a Dallas suburb—have higher job to<br />
resident worker ratios than their closest<br />
core municipality. 80<br />
This dispersion of work applies even<br />
in the oft-cited model for urban density,<br />
Portland, Oregon, where all the net new<br />
job growth was clustered in the suburbs<br />
and exurbs between 2000 and 2013. 81<br />
Nationwide, as the economy has improved,<br />
suburban locations—which account for<br />
more than 75 percent of all office space—<br />
rebounded faster than their more urban<br />
counterparts. Between 2012 and 2015,<br />
occupied suburban office space rose from<br />
75 percent of the market to 76.7 percent<br />
(with the balance located in CBDs). 82<br />
Employment growth continues to<br />
be stronger in the newer suburbs and<br />
exurban areas than in the urban core.<br />
More than 80 percent of employment<br />
growth from 2007 to 2013 was in the<br />
newer suburbs and exurbs. 83<br />
Perhaps the most critical<br />
employment developments are related<br />
to technology. Some claim that tech is<br />
now becoming an inner city industry,<br />
City<br />
Population,<br />
2012<br />
Highest Inequality 20th percentile 95th percentile<br />
1 Atlanta, GA<br />
2 San Francisco, CA<br />
3 Miami, FL<br />
4 Boston, MA<br />
5 Washington, DC<br />
6 New York, NY<br />
7 Oakland, CA<br />
8 Chicago, IL<br />
9 Los Angeles, CA<br />
10 Baltimore, MD<br />
443,768<br />
825,863<br />
413,864<br />
637,516<br />
632,323<br />
8,336,697<br />
400,740<br />
2,714,844<br />
3,857,786<br />
621,342<br />
$14,850<br />
$21,313<br />
$10,438<br />
$14,604<br />
$21,782<br />
$17,119<br />
$17,646<br />
$16,078<br />
$17,657<br />
$13,522<br />
Household Income, 2012<br />
Souce: Brooking Institution analysis of 2012 American Community Survey Data<br />
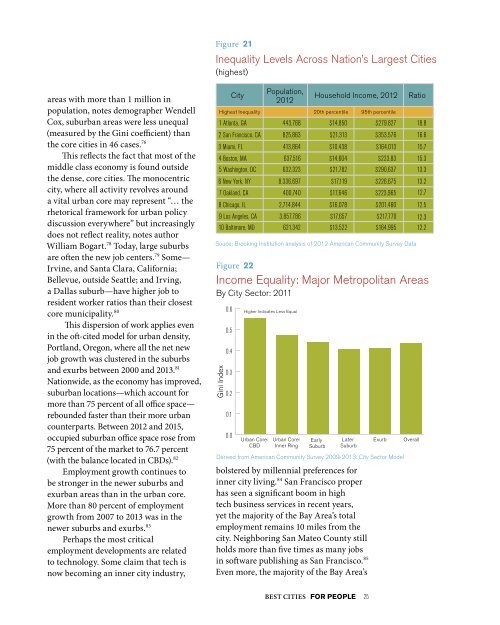
Figure 22<br />
Gini Index<br />
0.6 Higher Indicates Less Equal<br />
0.5<br />
0.4<br />
0.3<br />
0.2<br />
0.1<br />
0.0<br />
Urban Core:<br />
CBD<br />
Urban Core:<br />
Inner Ring<br />
Early<br />
Suburb<br />
Later<br />
Suburb<br />
bolstered by millennial preferences for<br />
Figure 23<br />
inner city living. 84 San Francisco proper<br />
has Office seen a Space significant by boom Location in high<br />
tech Major business Metropolitan services Areas: in recent 1950–2010 years,<br />
yet the majority of the Bay Area’s total<br />
Central Business<br />
employment remains 10 miles from the<br />
Districts<br />
city. Neighboring San Mateo (Downtown) County still<br />
holds more than five times as 23.3% many jobs<br />
in software publishing as San Francisco. 85<br />
Even more, the majority of the Bay Area’s<br />
Ratio<br />
$279.827 18.8<br />
$353,576 16.6<br />
$164,013 15.7<br />
$223,83 15.3<br />
$290,637 13.3<br />
$226,675 13.2<br />
$223,965 12.7<br />
$201,460 12.5<br />
$217,770 12.3<br />
$164,995 12.2<br />
Income Equality: Major Metropolitan Areas<br />
By City Sector: 2011<br />
Exurb<br />
Derived from American Community Survey 2009-2013: City Sector Model<br />
Overall<br />
BEST CITIES <strong>FOR</strong> <strong>PEOPLE</strong> 25