

Adopted Budget
XEhJr
XEhJr

You also want an ePaper? Increase the reach of your titles
YUMPU automatically turns print PDFs into web optimized ePapers that Google loves.
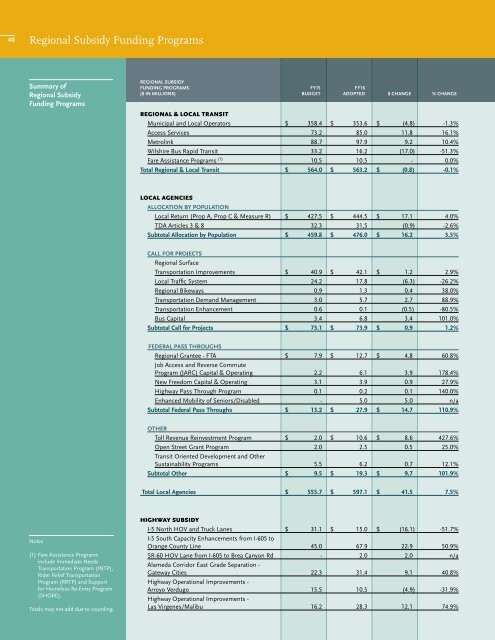
40<br />
Regional Subsidy Funding Programs<br />
summary of<br />
Regional subsidy<br />
Funding Programs<br />
ReGiOnAl sUBsiDy<br />
FUnDinG PROGRAMs Fy15 Fy16<br />
($ in MilliOns) BUDGeT ADOPTeD $ chAnGe % chAnGe<br />
regional & local transit<br />
Municipal and Local Operators $ 358.4 $ 353.6 $ (4.8) -1.3%<br />
Access Services 73.2 85.0 11.8 16.1%<br />
Metrolink 88.7 97.9 9.2 10.4%<br />
Wilshire Bus Rapid Transit 33.2 16.2 (17.0) -51.3%<br />
Fare Assistance Programs (1) 10.5 10.5 - 0.0%<br />
Total Regional & local Transit $ 564.0 $ 563.2 $ (0.8) -0.1%<br />
local agencies<br />
AllOcATiOn By POPUlATiOn<br />
Local Return (Prop A, Prop C & Measure R) $ 427.5 $ 444.5 $ 17.1 4.0%<br />
TDA Articles 3 & 8 32.3 31.5 (0.9) -2.6%<br />
subtotal Allocation by Population $ 459.8 $ 476.0 $ 16.2 3.5%<br />
cAll FOR PROJecTs<br />
Regional Surface<br />
Transportation Improvements $ 40.9 $ 42.1 $ 1.2 2.9%<br />
Local Traffic System 24.2 17.8 (6.3) -26.2%<br />
Regional Bikeways 0.9 1.3 0.4 38.0%<br />
Transportation Demand Management 3.0 5.7 2.7 88.9%<br />
Transportation Enhancement 0.6 0.1 (0.5) -80.5%<br />
Bus Capital 3.4 6.8 3.4 101.0%<br />
subtotal call for Projects $ 73.1 $ 73.9 $ 0.9 1.2%<br />
FeDeRAl PAss ThROUGhs<br />
Regional Grantee - FTA $ 7.9 $ 12.7 $ 4.8 60.8%<br />
Job Access and Reverse Commute<br />
Program (JARC) Capital & Operating 2.2 6.1 3.9 178.4%<br />
New Freedom Capital & Operating 3.1 3.9 0.9 27.9%<br />
Highway Pass Through Program 0.1 0.2 0.1 140.0%<br />
Enhanced Mobility of Seniors/Disabled - 5.0 5.0 n/a<br />
subtotal Federal Pass Throughs $ 13.2 $ 27.9 $ 14.7 110.9%<br />
OTheR<br />
Toll Revenue Reinvestment Program $ 2.0 $ 10.6 $ 8.6 427.6%<br />
Open Street Grant Program 2.0 2.5 0.5 25.0%<br />
Transit Oriented Development and Other<br />
Sustainability Programs 5.5 6.2 0.7 12.1%<br />
subtotal Other $ 9.5 $ 19.3 $ 9.7 101.9%<br />
Total local Agencies $ 555.7 $ 597.1 $ 41.5 7.5%<br />
Notes<br />
(1) Fare Assistance Programs<br />
include Immediate Needs<br />
Transportation Program (INTP),<br />
Rider Relief Transportation<br />
Program (RRTP) and Support<br />
for Homeless Re-Entry Program<br />
(SHORE).<br />
Totals may not add due to rounding.<br />
highway suBsidy<br />
I-5 North HOV and Truck Lanes $ 31.1 $ 15.0 $ (16.1) -51.7%<br />
I-5 South Capacity Enhancements from I-605 to<br />
Orange County Line 45.0 67.9 22.9 50.9%<br />
SR-60 HOV Lane from I-605 to Brea Canyon Rd - 2.0 2.0 n/a<br />
Alameda Corridor East Grade Separation -<br />
Gateway Cities 22.3 31.4 9.1 40.8%<br />
Highway Operational Improvements -<br />
Arroyo Verdugo 15.5 10.5 (4.9) -31.9%<br />
Highway Operational Improvements -<br />
Las Virgenes/Malibu 16.2 28.3 12.1 74.9%