

Adopted Budget
XEhJr
XEhJr

Create successful ePaper yourself
Turn your PDF publications into a flip-book with our unique Google optimized e-Paper software.
76<br />
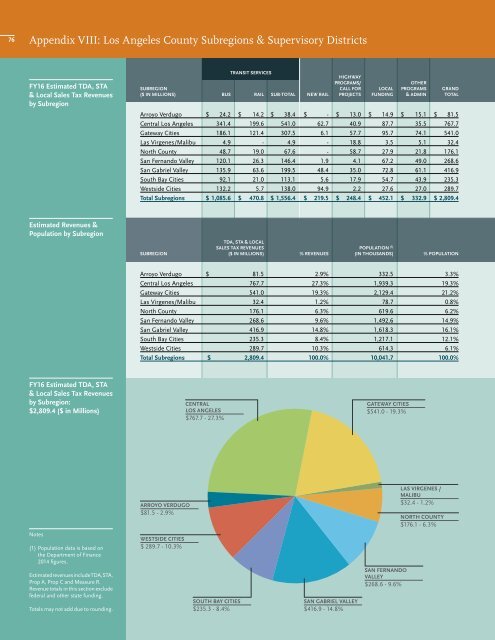
Appendix VIII: Los Angeles County Subregions & Supervisory Districts<br />
Fy16 estimated TDA, sTA<br />
& local sales Tax Revenues<br />
by subregion<br />
TRAnsiT seRvices<br />
hiGhwAy<br />
PROGRAMs/<br />
OTheR<br />
sUBReGiOn cAll FOR lOcAl PROGRAMs GRAnD<br />
($ in MilliOns) BUs RAil sUB-TOTAl new RAil PROJecTs FUnDinG & ADMin TOTAl<br />
Arroyo Verdugo $ 24.2 $ 14.2 $ 38.4 $ - $ 13.0 $ 14.9 $ 15.1 $ 81.5<br />
Central Los Angeles 341.4 199.6 541.0 62.7 40.9 87.7 35.5 767.7<br />
Gateway Cities 186.1 121.4 307.5 6.1 57.7 95.7 74.1 541.0<br />
Las Virgenes/Malibu 4.9 - 4.9 - 18.8 3.5 5.1 32.4<br />
North County 48.7 19.0 67.6 - 58.7 27.9 21.8 176.1<br />
San Fernando Valley 120.1 26.3 146.4 1.9 4.1 67.2 49.0 268.6<br />
San Gabriel Valley 135.9 63.6 199.5 48.4 35.0 72.8 61.1 416.9<br />
South Bay Cities 92.1 21.0 113.1 5.6 17.9 54.7 43.9 235.3<br />
Westside Cities 132.2 5.7 138.0 94.9 2.2 27.6 27.0 289.7<br />
Total subregions $ 1,085.6 $ 470.8 $ 1,556.4 $ 219.5 $ 248.4 $ 452.1 $ 332.9 $ 2,809.4<br />
estimated Revenues &<br />
Population by subregion<br />
TDA, sTA & lOcAl<br />
sAles TAx RevenUes POPUlATiOn (1)<br />
sUBReGiOn ($ in MilliOns) % RevenUes (in ThOUsAnDs) % POPUlATiOn<br />
Arroyo Verdugo $ 81.5 2.9% 332.5 3.3%<br />
Central Los Angeles 767.7 27.3% 1,939.3 19.3%<br />
Gateway Cities 541.0 19.3% 2,129.4 21.2%<br />
Las Virgenes/Malibu 32.4 1.2% 78.7 0.8%<br />
North County 176.1 6.3% 619.6 6.2%<br />
San Fernando Valley 268.6 9.6% 1,492.6 14.9%<br />
San Gabriel Valley 416.9 14.8% 1,618.3 16.1%<br />
South Bay Cities 235.3 8.4% 1,217.1 12.1%<br />
Westside Cities 289.7 10.3% 614.3 6.1%<br />
Total subregions $ 2,809.4 100.0% 10,041.7 100.0%<br />
Fy16 estimated TDA, sTA<br />
& local sales Tax Revenues<br />
by subregion:<br />
$2,809.4 ($ in Millions)<br />
CENTRAL<br />
LOS ANGELES<br />
$767.7 - 27.3%<br />
GATEWAY CITIES<br />
$541.0 - 19.3%<br />
ARROYO VERDuGO<br />
$81.5 - 2.9%<br />
LAS VIRGENES /<br />
MALIBu<br />
$32.4 - 1.2%<br />
NORTH COuNTY<br />
$176.1 - 6.3%<br />
Notes<br />
(1) Population data is based on<br />
the Department of Finance<br />
2014 figures.<br />
Estimated revenues include TDA, STA,<br />
Prop A, Prop C and Measure R.<br />
Revenue totals in this section exclude<br />
federal and other state funding.<br />
Totals may not add due to rounding.<br />
WESTSIDE CITIES<br />
$ 289.7 - 10.3%<br />
SOuTH BAY CITIES<br />
$235.3 - 8.4%<br />
SAN GABRIEL VALLEY<br />
$416.9 - 14.8%<br />
SAN FERNANDO<br />
VALLEY<br />
$268.6 - 9.6%