

1owHYXa
1owHYXa
1owHYXa

Create successful ePaper yourself
Turn your PDF publications into a flip-book with our unique Google optimized e-Paper software.
Friday, February 19, 2016<br />
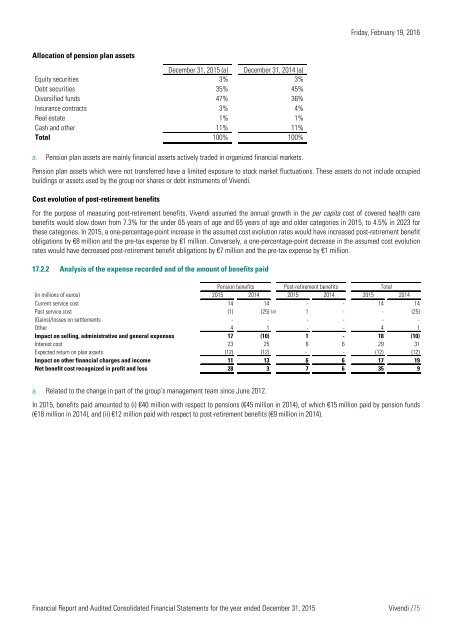
Allocation of pension plan assets<br />
December 31, 2015 (a) December 31, 2014 (a)<br />
Equity securities 3% 3%<br />
Debt securities 35% 45%<br />
Diversified funds 47% 36%<br />
Insurance contracts 3% 4%<br />
Real estate 1% 1%<br />
Cash and other 11% 11%<br />
Total 100% 100%<br />
a. Pension plan assets are mainly financial assets actively traded in organized financial markets.<br />
Pension plan assets which were not transferred have a limited exposure to stock market fluctuations. These assets do not include occupied<br />
buildings or assets used by the group nor shares or debt instruments of Vivendi.<br />
Cost evolution of post-retirement benefits<br />
For the purpose of measuring post-retirement benefits, Vivendi assumed the annual growth in the per capita cost of covered health care<br />
benefits would slow down from 7.3% for the under 65 years of age and 65 years of age and older categories in 2015, to 4.5% in 2023 for<br />
these categories. In 2015, a one-percentage-point increase in the assumed cost evolution rates would have increased post-retirement benefit<br />
obligations by €8 million and the pre-tax expense by €1 million. Conversely, a one-percentage-point decrease in the assumed cost evolution<br />
rates would have decreased post-retirement benefit obligations by €7 million and the pre-tax expense by €1 million.<br />
17.2.2 Analysis of the expense recorded and of the amount of benefits paid<br />
Pension benefits Post-retirement benefits Total<br />
(in millions of euros) 2015 2014 2015 2014 2015 2014<br />
Current service cost 14 14 - - 14 14<br />
Past service cost (1) (25) (a) 1 - - (25)<br />
(Gains)/losses on settlements - - - - - -<br />
Other 4 1 - - 4 1<br />
Impact on selling, administrative and general expenses 17 (10) 1 - 18 (10)<br />
Interest cost 23 25 6 6 29 31<br />
Expected return on plan assets (12) (12) - - (12) (12)<br />
Impact on other financial charges and income 11 13 6 6 17 19<br />
Net benefit cost recognized in profit and loss 28 3 7 6 35 9<br />
a. Related to the change in part of the group’s management team since June 2012.<br />
In 2015, benefits paid amounted to (i) €40 million with respect to pensions (€45 million in 2014), of which €15 million paid by pension funds<br />
(€18 million in 2014), and (ii) €12 million paid with respect to post-retirement benefits (€9 million in 2014).<br />
Financial Report and Audited Consolidated Financial Statements for the year ended December 31, 2015 Vivendi /75