

1owHYXa
1owHYXa
1owHYXa

You also want an ePaper? Increase the reach of your titles
YUMPU automatically turns print PDFs into web optimized ePapers that Google loves.
Friday, February 19, 2016<br />
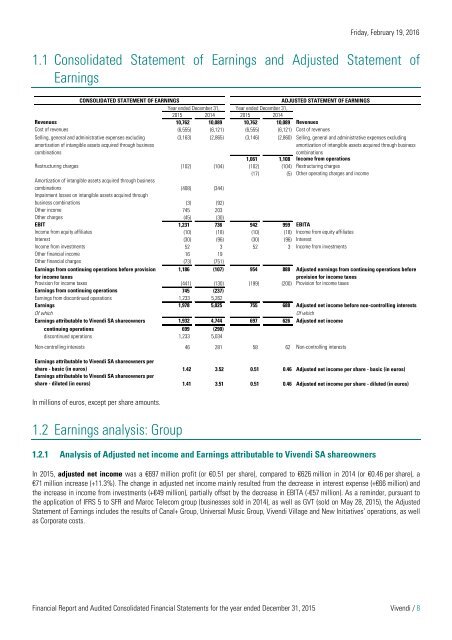
1.1 Consolidated Statement of Earnings and Adjusted Statement of<br />
Earnings<br />
CONSOLIDATED STATEMENT OF EARNINGS<br />
ADJUSTED STATEMENT OF EARNINGS<br />
Year ended December 31, Year ended December 31,<br />
2015 2014 2015 2014<br />
Revenues 10,762 10,089 10,762 10,089 Revenues<br />
Cost of revenues (6,555) (6,121) (6,555) (6,121) Cost of revenues<br />
Selling, general and administrative expenses excluding<br />
amortization of intangible assets acquired through business<br />
combinations<br />
(3,163) (2,865) (3,146) (2,860) Selling, general and administrative expenses excluding<br />
amortization of intangible assets acquired through business<br />
combinations<br />
1,061 1,108 Income from operations<br />
Restructuring charges (102) (104) (102) (104) Restructuring charges<br />
(17) (5) Other operating charges and income<br />
Amortization of intangible assets acquired through business<br />
combinations (408) (344)<br />
Impairment losses on intangible assets acquired through<br />
business combinations (3) (92)<br />
Other income 745 203<br />
Other charges (45) (30)<br />
EBIT 1,231 736 942 999 EBITA<br />
Income from equity affiliates (10) (18) (10) (18) Income from equity affiliates<br />
Interest (30) (96) (30) (96) Interest<br />
Income from investments 52 3 52 3 Income from investments<br />
Other financial income 16 19<br />
Other financial charges (73) (751)<br />
Earnings from continuing operations before provision<br />
for income taxes<br />
1,186 (107) 954 888 Adjusted earnings from continuing operations before<br />
provision for income taxes<br />
Provision for income taxes (441) (130) (199) (200) Provision for income taxes<br />
Earnings from continuing operations 745 (237)<br />
Earnings from discontinued operations 1,233 5,262<br />
Earnings 1,978 5,025 755 688 Adjusted net income before non-controlling interests<br />
Of which<br />
Of which<br />
Earnings attributable to Vivendi SA shareowners 1,932 4,744 697 626 Adjusted net income<br />
continuing operations 699 (290)<br />
discontinued operations 1,233 5,034<br />
Non-controlling interests 46 281 58 62 Non-controlling interests<br />
Earnings attributable to Vivendi SA shareowners per<br />
share - basic (in euros) 1.42 3.52 0.51 0.46 Adjusted net income per share - basic (in euros)<br />
Earnings attributable to Vivendi SA shareowners per<br />
share - diluted (in euros) 1.41 3.51 0.51 0.46 Adjusted net income per share - diluted (in euros)<br />
In millions of euros, except per share amounts.<br />
1.2 Earnings analysis: Group<br />
1.2.1 Analysis of Adjusted net income and Earnings attributable to Vivendi SA shareowners<br />
In 2015, adjusted net income was a €697 million profit (or €0.51 per share), compared to €626 million in 2014 (or €0.46 per share), a<br />
€71 million increase (+11.3%). The change in adjusted net income mainly resulted from the decrease in interest expense (+€66 million) and<br />
the increase in income from investments (+€49 million), partially offset by the decrease in EBITA (-€57 million). As a reminder, pursuant to<br />
the application of IFRS 5 to SFR and Maroc Telecom group (businesses sold in 2014), as well as GVT (sold on May 28, 2015), the Adjusted<br />
Statement of Earnings includes the results of Canal+ Group, Universal Music Group, Vivendi Village and New Initiatives’ operations, as well<br />
as Corporate costs.<br />
Financial Report and Audited Consolidated Financial Statements for the year ended December 31, 2015 Vivendi / 8