


You also want an ePaper? Increase the reach of your titles
YUMPU automatically turns print PDFs into web optimized ePapers that Google loves.
carrying higher rates and other risky features.10 <strong>The</strong> Center for Community Capital found that the<br />
CAP loan “serious delinquency” rate (capturing borrowers who were more than 90 days late on a<br />
mortgage payment) was one-third that <strong>of</strong> subprime adjustable-rate loans and one-half that <strong>of</strong> subprime<br />
fixed-rate loans (Freedman & Ratcliffe, 2012). CAP borrowers also built wealth even during<br />
this tumultuous period: Median home equity across the portfolio was $18,000, with positive returns<br />
on investment <strong>of</strong> 27% through the third quarter in 2011. And CAP borrowers <strong>of</strong> all income groups<br />
had a higher net worth than similarly-situated renters, both before and after the recession (Freeman<br />
& Ratcliffe, 2012).<br />
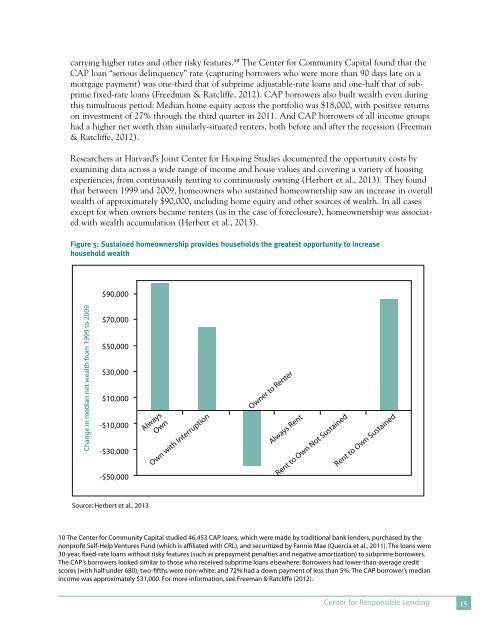
Researchers at Harvard’s Joint Center for Housing Studies documented the opportunity costs by<br />
examining data across a wide range <strong>of</strong> income and house values and covering a variety <strong>of</strong> housing<br />
experiences, from continuously renting to continuously owning (Herbert et al., 2013). <strong>The</strong>y found<br />
that between 1999 and 2009, homeowners who sustained homeownership saw an increase in overall<br />
wealth <strong>of</strong> approximately $90,000, including home equity and other sources <strong>of</strong> wealth. In all cases<br />
except for when owners became renters (as in the case <strong>of</strong> foreclosure), homeownership was associated<br />
with wealth accumulation (Herbert et al., 2013).<br />
Figure 5: Sustained homeownership provides households the greatest opportunity to increase<br />
household wealth<br />
$90,000<br />
Change in median net wealth from 1999 to 2009<br />
$70,000<br />
$50,000<br />
$30,000<br />
$10,000<br />
-$10,000<br />
-$30,000<br />
-$50,000<br />
Always<br />
Own<br />
Own with Interruption<br />
Owner to Renter<br />
Always Rent<br />
Rent to Own Not Sustained<br />
Rent to Own Sustained<br />
Source: Herbert et al., 2013<br />
10 <strong>The</strong> Center for Community Capital studied 46,453 CAP loans, which were made by traditional bank lenders, purchased by the<br />
nonpr<strong>of</strong>it Self-Help Ventures Fund (which is affiliated with CRL), and securitized by Fannie Mae (Quercia et al., 2011). <strong>The</strong> loans were<br />
30-year, fixed-rate loans without risky features (such as prepayment penalties and negative amortization) to subprime borrowers.<br />
<strong>The</strong> CAP’s borrowers looked similar to those who received subprime loans elsewhere: Borrowers had lower-than-average credit<br />
scores (with half under 680); two-fifths were non-white; and 72% had a down payment <strong>of</strong> less than 5%. <strong>The</strong> CAP borrower’s median<br />
income was approximately $31,000. For more information, see Freeman & Ratcliffe (2012).<br />
Center for Responsible Lending 15