


You also want an ePaper? Increase the reach of your titles
YUMPU automatically turns print PDFs into web optimized ePapers that Google loves.
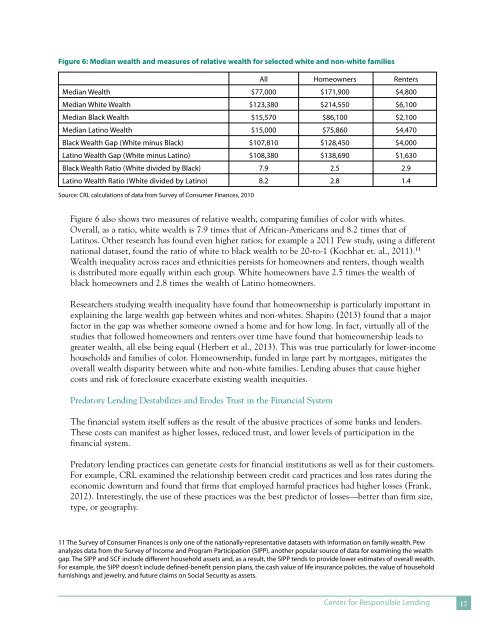
Figure 6: Median wealth and measures <strong>of</strong> relative wealth for selected white and non-white families<br />
All Homeowners Renters<br />
Median Wealth $77,000 $171,900 $4,800<br />
Median White Wealth $123,380 $214,550 $6,100<br />
Median Black Wealth $15,570 $86,100 $2,100<br />
Median Latino Wealth $15,000 $75,860 $4,470<br />
Black Wealth Gap (White minus Black) $107,810 $128,450 $4,000<br />
Latino Wealth Gap (White minus Latino) $108,380 $138,690 $1,630<br />
Black Wealth Ratio (White divided by Black) 7.9 2.5 2.9<br />
Latino Wealth Ratio (White divided by Latino) 8.2 2.8 1.4<br />
Source: CRL calculations <strong>of</strong> data from Survey <strong>of</strong> Consumer Finances, 2010<br />
Figure 6 also shows two measures <strong>of</strong> relative wealth, comparing families <strong>of</strong> color with whites.<br />
Overall, as a ratio, white wealth is 7.9 times that <strong>of</strong> African-Americans and 8.2 times that <strong>of</strong><br />
Latinos. Other research has found even higher ratios; for example a 2011 Pew study, using a different<br />
national dataset, found the ratio <strong>of</strong> white to black wealth to be 20-to-1 (Kochhar et. al., 2011).11<br />
Wealth inequality across races and ethnicities persists for homeowners and renters, though wealth<br />
is distributed more equally within each group. White homeowners have 2.5 times the wealth <strong>of</strong><br />
black homeowners and 2.8 times the wealth <strong>of</strong> Latino homeowners.<br />
Researchers studying wealth inequality have found that homeownership is particularly important in<br />
explaining the large wealth gap between whites and non-whites. Shapiro (2013) found that a major<br />
factor in the gap was whether someone owned a home and for how long. In fact, virtually all <strong>of</strong> the<br />
studies that followed homeowners and renters over time have found that homeownership leads to<br />
greater wealth, all else being equal (Herbert et al., 2013). This was true particularly for lower-income<br />
households and families <strong>of</strong> color. Homeownership, funded in large part by mortgages, mitigates the<br />
overall wealth disparity between white and non-white families. Lending abuses that cause higher<br />
costs and risk <strong>of</strong> foreclosure exacerbate existing wealth inequities.<br />
<strong>Predatory</strong> Lending Destabilizes and Erodes Trust in the Financial System<br />
<strong>The</strong> financial system itself suffers as the result <strong>of</strong> the abusive practices <strong>of</strong> some banks and lenders.<br />
<strong>The</strong>se costs can manifest as higher losses, reduced trust, and lower levels <strong>of</strong> participation in the<br />
financial system.<br />
<strong>Predatory</strong> lending practices can generate costs for financial institutions as well as for their customers.<br />
For example, CRL examined the relationship between credit card practices and loss rates during the<br />
economic downturn and found that firms that employed harmful practices had higher losses (Frank,<br />
2012). Interestingly, the use <strong>of</strong> these practices was the best predictor <strong>of</strong> losses—better than firm size,<br />
type, or geography.<br />
11 <strong>The</strong> Survey <strong>of</strong> Consumer Finances is only one <strong>of</strong> the nationally-representative datasets with information on family wealth. Pew<br />
analyzes data from the Survey <strong>of</strong> Income and Program Participation (SIPP), another popular source <strong>of</strong> data for examining the wealth<br />
gap. <strong>The</strong> SIPP and SCF include different household assets and, as a result, the SIPP tends to provide lower estimates <strong>of</strong> overall wealth.<br />
For example, the SIPP doesn’t include defined-benefit pension plans, the cash value <strong>of</strong> life insurance policies, the value <strong>of</strong> household<br />
furnishings and jewelry, and future claims on Social Security as assets.<br />
Center for Responsible Lending 17