- Page 1 and 2:
Crop Yield Forecasting: Methodologi
- Page 3 and 4:
This publication was prepared with
- Page 5 and 6:
Contents Acknowledgements 9 Preface
- Page 7 and 8:
3. Linking up with crop production
- Page 9 and 10:
ANNEXES............................
- Page 11 and 12:
10 Crop Yield Forecasting: Methodol
- Page 13 and 14:
org) monitors current year conditio
- Page 15 and 16:
eference dataset, whereas actors of
- Page 17 and 18:
Remaining challenges The main unkno
- Page 19 and 20:
DAFF DBMS DEM DG-AGRI DMN DMP DPO D
- Page 21 and 22:
RMSE RS RSAC RSS RVI SACOTA SAFEX S
- Page 23 and 24:
FIGURE 4.10 FIGURE 4.11 FIGURE 4.12
- Page 25 and 26:
24 Crop Yield Forecasting: Methodol
- Page 27 and 28:
FIGURE 1.1 B-CGMS descriptive flowc
- Page 29 and 30:
the CGMS. The CGMS uses daily meteo
- Page 31 and 32:
estimate is computed by interviewin
- Page 33 and 34:
FIGURE 1.2. Synthetic flowchart of
- Page 35 and 36:
B1.8., Annex B1.2). The historical
- Page 37 and 38:
• CIPF; • CRA-W; • Centre de
- Page 39 and 40:
2.2.8. The Crop Growth Simulation M
- Page 41 and 42:
take place, and the maximum daily t
- Page 43 and 44:
sought to minimize the prediction e
- Page 45 and 46:
Therefore, to optimize and automate
- Page 47 and 48:
FIGURE 1.6. Architecture of the B-C
- Page 49 and 50:
2.5. Human, financial and technical
- Page 51 and 52:
in 2014 49 . Preliminary yield esti
- Page 53 and 54:
national level) for 2014. GIS syste
- Page 55 and 56:
1.2. Inventory of forecasts availab
- Page 57 and 58:
and production can be predicted one
- Page 59 and 60:
1.4. How do these different forecas
- Page 61 and 62:
2. China national official sources:
- Page 63 and 64:
The NSRCP’s key technology includ
- Page 65 and 66:
2.1.2. Methodology and practices of
- Page 67 and 68:
FIGURE 2.2 Flow chart of NDVI-based
- Page 69 and 70:
2.1.3 Methodology and practices of
- Page 71 and 72:
various periods. By integrating thr
- Page 73 and 74:
indices have been developed, and th
- Page 75 and 76:
FIGURE 2.3 Data sources and institu
- Page 77 and 78:
2.4. Human, financial and technical
- Page 79 and 80:
method is applied to choose three t
- Page 81 and 82:
accuracy of the RS indicator and th
- Page 83 and 84:
TABLE 2.4 Crop calendar and release
- Page 85 and 86:
Institute for Research and Technolo
- Page 87 and 88:
■■ Yield • Phenological Event
- Page 89 and 90:
2. Morocco’s national official so
- Page 91 and 92: • Level 3: Forecast of crop yield
- Page 93 and 94: TABLE 3.5 Meteorological variables
- Page 95 and 96: two are pre-processing tasks (see F
- Page 97 and 98: FIGURE 3.5 Output data from Levels
- Page 99 and 100: • The agricultural mask, that wil
- Page 101 and 102: FIGURE 3.8 The coefficient of deter
- Page 103 and 104: involved in agriculture, and is sup
- Page 105 and 106: 3.1.1.1. Area and Methodology used
- Page 107 and 108: variable and the total rainfall of
- Page 109 and 110: TABLE 3.8 Crop calendars and releas
- Page 111 and 112: 110 Crop Yield Forecasting: Methodo
- Page 113 and 114: In administrative terms, South Afri
- Page 115 and 116: 1.2.1.1. The role of the Crop Estim
- Page 117 and 118: to submit information. The main aim
- Page 119 and 120: SAGIS releases the following inform
- Page 121 and 122: FIGURE 4.2 Percentage of over/under
- Page 123 and 124: the results from a subjective telep
- Page 125 and 126: a point sample frame. Three types o
- Page 127 and 128: Sample frame To set up the sample s
- Page 129 and 130: North West are allocated proportion
- Page 131 and 132: FIGURE 4.7 Methodology for determin
- Page 133 and 134: 2.2.3. Provincial Department of Agr
- Page 135 and 136: • Southern Annular Mode (SAM) fro
- Page 137 and 138: To facilitate the running of such a
- Page 139 and 140: 2.6. Innovation and integration wit
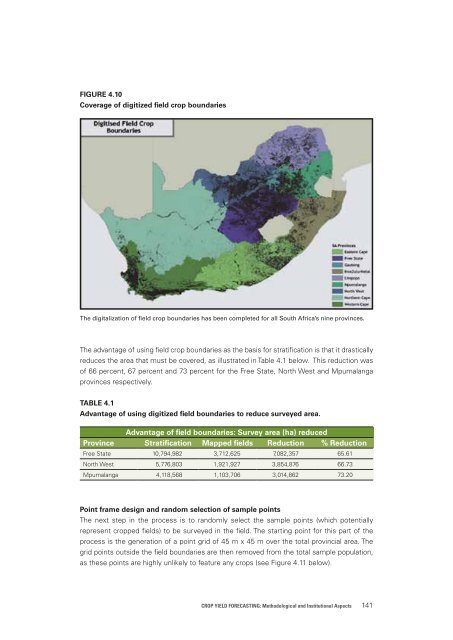
- Page 141: Digitization has been completed for
- Page 145 and 146: georeferenced. In addition to the o
- Page 147 and 148: of generating signature classes for
- Page 149 and 150: and along with the infra-red bands
- Page 151 and 152: 150 Crop Yield Forecasting: Methodo
- Page 153 and 154: the National Agricultural Statistic
- Page 155 and 156: 1.2.3. Other regional and global so
- Page 157 and 158: 1.4. How do these different forecas
- Page 159 and 160: commodity of interest within the op
- Page 161 and 162: Potato and winter wheat acres are c
- Page 163 and 164: During the growing season, the NASS
- Page 165 and 166: 3. Linking up with crop production
- Page 167 and 168: 166 Crop Yield Forecasting: Methodo
- Page 169 and 170: drying have been taken into account
- Page 171 and 172: 170 Crop Yield Forecasting: Methodo
- Page 173 and 174: Meteorological data • USA-NOAA ht
- Page 175 and 176: FIGURE B1.2 Grid covering the area
- Page 177 and 178: Annex B1.2 - The JRC-MARS Crop Yiel
- Page 179 and 180: FIGURE B1.8 MCYFS: Synthetic schema
- Page 181 and 182: FIGURE B1.10 The CGMS Statistical T
- Page 183 and 184: IDSL indicates whether pre-anthesis
- Page 185 and 186: Annex B1.5 - Websites Country Natio
- Page 187 and 188: N_A5 By August 25 Seasonal report o
- Page 189 and 190: IV. Official releases of crop produ
- Page 191 and 192: M P7 M P8 _ By October 25 _ By Nove
- Page 193 and 194:
Annex B2.2 - Websites Country China
- Page 195 and 196:
FIGURE B3.2 Agrometeorological bull
- Page 197 and 198:
FIGURE B3.6 CGMS-MAROC’s web-mapp
- Page 199 and 200:
FIGURE B3.10 Crop production foreca
- Page 201 and 202:
from the various models are inserte
- Page 203 and 204:
FIGURE B3.14 Descriptive schema of
- Page 205 and 206:
Annex B3.3 - Websites Country Natio
- Page 207 and 208:
FIGURE B4.2 Gross income (South Afr
- Page 209 and 210:
Annex B4.3 - Example of SAGIS publi
- Page 211 and 212:
4.2 Definition Oilseeds are defined
- Page 213 and 214:
Other countries estimate production
- Page 215 and 216:
Annex B4.5 - Advanced Sample Framew
- Page 217 and 218:
216 Crop Yield Forecasting: Methodo
- Page 219 and 220:
FIGURE B5.2 USDA-FAS-PECAD: Crop Ex
- Page 221 and 222:
FIGURE B5.3A CropScape: Cropland Da
- Page 223 and 224:
FIGURE B5.7 Global Agricultural Mon
- Page 225 and 226:
224 Crop Yield Forecasting: Methodo
- Page 227 and 228:
Navalgund, R.R., Parihar J.S., Ajai
- Page 229 and 230:
Royer, A. & Genovese, G. (eds). 200
- Page 231 and 232:
Huang, J., Wang, X., Li, X., Tian,
- Page 233 and 234:
Wang, M. & Wei, G. 2014. Promoting
- Page 235 and 236:
Zhao, J., Shi, K. & Wei, F. 2007. R
- Page 237 and 238:
Hutson, J.L. 1984. Estimation of hy
- Page 239 and 240:
Huddleston, H.F. 1978. Sampling tec
- Page 241:
Layout: • Laura Monopoli Cover ph