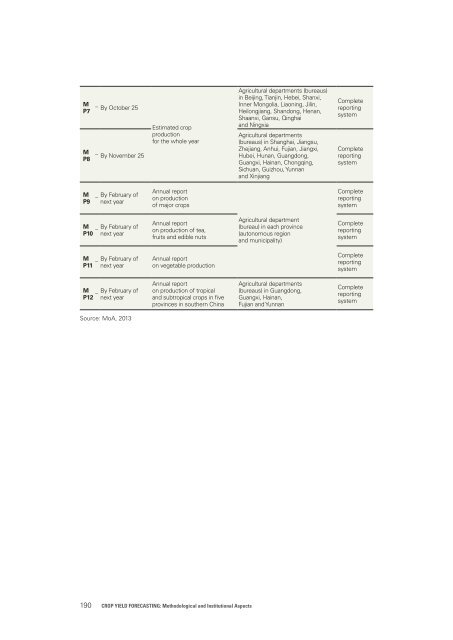
M_A4 By November 26 M_A5 By December 27 Estimated autumn and winter sown area (including winter wheat and rapeseed) III. Production Estimates Agricultural departments (bureaus) Complete in Beijing, Tianjin, Hebei, Shanxi, reporting Liaoning, Shandong, Henan, Shaanxi, system Gansu, Ningxia and Xinjiang Agricultural departments (bureaus) in Shanghai, Jiangsu, Zhejiang, Anhui, Jiangxi, Fujian, Hubei, Hunan, Guangdong, Guangxi, Hainan, Chongqing, Sichuan, Guizhou and Yunnan Complete reporting system ID Reporting date Category Reporter Method M_P1 By May 10 and June 20 Estimated production of summer grain and oil crops Agricultural departments (bureaus) at sample counties in Beijing, Tianjin, Hebei, Shanxi, Liaoning, Shandong, Henan, Shaanxi, Gansu, Ningxia, Xinjiang, Shanghai, Jiangsu, Zhejiang, Sampling Anhui, Jiangxi, Fujian, Hubei, Hunan, survey Guangdong, Guangxi, Hainan, Chongqing, Sichuan, Guizhou and Yunnan Provinces (autonomous regions and municipalities) M_P2 By June 30 (including winter wheat and rapeseed) Agricultural departments (bureaus) in Beijing, Tianjin, Hebei, Shanxi, Liaoning, Shanghai, Jiangsu, Zhejiang, Anhui, Fujian, Jiangxi, Shandong, Henan, Hubei, Hunan, Guangdong, Guangxi, Hainan, Chongqing, Sichuan, Guizhou, Yunnan, Shaanxi, Gansu, Ningxia and Xinjiang Complete reporting system M_P3 By June 30 Estimated production of spring wheat Agricultural departments (bureaus) at sample counties in Heilongjiang, Inner Mongolia, Qinghai, Xinjiang Ningxia and Gansu Provinces (autonomous regions and municipalities) Sampling survey M_P4 By June 30 Estimated production of early rice Agricultural departments (bureaus) at sample counties in Zhejiang, Anhui, Jiangxi, Fujian, Hubei, Hunan, Guangdong, Guangxi, Hainan, Sichuan and Yunnan Provinces (autonomous regions and municipalities) Sampling survey M_P5 By July 30 Agricultural departments (bureaus) Complete in Zhejiang, Anhui, Jiangxi, Fujian, reporting Hubei, Hunan, Guangdong, system Guangxi, Hainan, Sichuan and Yunnan M_P6 By September 24 Estimated production of autumn crops (including middle rice, late rice, maize, soybean and cotton) Agricultural departments (bureaus) at sample counties in each Province (autonomous region and municipality) Sampling survey <strong>Crop</strong> <strong>Yield</strong> <strong>Forecasting</strong>: Methodological and Institutional Aspects 189
M P7 M P8 _ By October 25 _ By November 25 Estimated crop production for the whole year Agricultural departments (bureaus) in Beijing, Tianjin, Hebei, Shanxi, Inner Mongolia, Liaoning, Jilin, Heilongjiang, Shandong, Henan, Shaanxi, Gansu, Qinghai and Ningxia Agricultural departments (bureaus) in Shanghai, Jiangsu, Zhejiang, Anhui, Fujian, Jiangxi, Hubei, Hunan, Guangdong, Guangxi, Hainan, Chongqing, Sichuan, Guizhou, Yunnan and Xinjiang Complete reporting system Complete reporting system M P9 _ By February of next year Annual report on production of major crops Complete reporting system M _ By February of P10 next year Annual report on production of tea, fruits and edible nuts Agricultural department (bureau) in each province (autonomous region and municipality) Complete reporting system M _ By February of P11 next year Annual report on vegetable production Complete reporting system M _ By February of P12 next year Annual report on production of tropical and subtropical crops in five provinces in southern China Agricultural departments (bureaus) in Guangdong, Guangxi, Hainan, Fujian and Yunnan Complete reporting system Source: MoA, 2013 190 <strong>Crop</strong> <strong>Yield</strong> <strong>Forecasting</strong>: Methodological and Institutional Aspects
- Page 1 and 2:
Crop Yield Forecasting: Methodologi
- Page 3 and 4:
This publication was prepared with
- Page 5 and 6:
Contents Acknowledgements 9 Preface
- Page 7 and 8:
3. Linking up with crop production
- Page 9 and 10:
ANNEXES............................
- Page 11 and 12:
10 Crop Yield Forecasting: Methodol
- Page 13 and 14:
org) monitors current year conditio
- Page 15 and 16:
eference dataset, whereas actors of
- Page 17 and 18:
Remaining challenges The main unkno
- Page 19 and 20:
DAFF DBMS DEM DG-AGRI DMN DMP DPO D
- Page 21 and 22:
RMSE RS RSAC RSS RVI SACOTA SAFEX S
- Page 23 and 24:
FIGURE 4.10 FIGURE 4.11 FIGURE 4.12
- Page 25 and 26:
24 Crop Yield Forecasting: Methodol
- Page 27 and 28:
FIGURE 1.1 B-CGMS descriptive flowc
- Page 29 and 30:
the CGMS. The CGMS uses daily meteo
- Page 31 and 32:
estimate is computed by interviewin
- Page 33 and 34:
FIGURE 1.2. Synthetic flowchart of
- Page 35 and 36:
B1.8., Annex B1.2). The historical
- Page 37 and 38:
• CIPF; • CRA-W; • Centre de
- Page 39 and 40:
2.2.8. The Crop Growth Simulation M
- Page 41 and 42:
take place, and the maximum daily t
- Page 43 and 44:
sought to minimize the prediction e
- Page 45 and 46:
Therefore, to optimize and automate
- Page 47 and 48:
FIGURE 1.6. Architecture of the B-C
- Page 49 and 50:
2.5. Human, financial and technical
- Page 51 and 52:
in 2014 49 . Preliminary yield esti
- Page 53 and 54:
national level) for 2014. GIS syste
- Page 55 and 56:
1.2. Inventory of forecasts availab
- Page 57 and 58:
and production can be predicted one
- Page 59 and 60:
1.4. How do these different forecas
- Page 61 and 62:
2. China national official sources:
- Page 63 and 64:
The NSRCP’s key technology includ
- Page 65 and 66:
2.1.2. Methodology and practices of
- Page 67 and 68:
FIGURE 2.2 Flow chart of NDVI-based
- Page 69 and 70:
2.1.3 Methodology and practices of
- Page 71 and 72:
various periods. By integrating thr
- Page 73 and 74:
indices have been developed, and th
- Page 75 and 76:
FIGURE 2.3 Data sources and institu
- Page 77 and 78:
2.4. Human, financial and technical
- Page 79 and 80:
method is applied to choose three t
- Page 81 and 82:
accuracy of the RS indicator and th
- Page 83 and 84:
TABLE 2.4 Crop calendar and release
- Page 85 and 86:
Institute for Research and Technolo
- Page 87 and 88:
■■ Yield • Phenological Event
- Page 89 and 90:
2. Morocco’s national official so
- Page 91 and 92:
• Level 3: Forecast of crop yield
- Page 93 and 94:
TABLE 3.5 Meteorological variables
- Page 95 and 96:
two are pre-processing tasks (see F
- Page 97 and 98:
FIGURE 3.5 Output data from Levels
- Page 99 and 100:
• The agricultural mask, that wil
- Page 101 and 102:
FIGURE 3.8 The coefficient of deter
- Page 103 and 104:
involved in agriculture, and is sup
- Page 105 and 106:
3.1.1.1. Area and Methodology used
- Page 107 and 108:
variable and the total rainfall of
- Page 109 and 110:
TABLE 3.8 Crop calendars and releas
- Page 111 and 112:
110 Crop Yield Forecasting: Methodo
- Page 113 and 114:
In administrative terms, South Afri
- Page 115 and 116:
1.2.1.1. The role of the Crop Estim
- Page 117 and 118:
to submit information. The main aim
- Page 119 and 120:
SAGIS releases the following inform
- Page 121 and 122:
FIGURE 4.2 Percentage of over/under
- Page 123 and 124:
the results from a subjective telep
- Page 125 and 126:
a point sample frame. Three types o
- Page 127 and 128:
Sample frame To set up the sample s
- Page 129 and 130:
North West are allocated proportion
- Page 131 and 132:
FIGURE 4.7 Methodology for determin
- Page 133 and 134:
2.2.3. Provincial Department of Agr
- Page 135 and 136:
• Southern Annular Mode (SAM) fro
- Page 137 and 138:
To facilitate the running of such a
- Page 139 and 140: 2.6. Innovation and integration wit
- Page 141 and 142: Digitization has been completed for
- Page 143 and 144: FIGURE 4.11 Random selection of a p
- Page 145 and 146: georeferenced. In addition to the o
- Page 147 and 148: of generating signature classes for
- Page 149 and 150: and along with the infra-red bands
- Page 151 and 152: 150 Crop Yield Forecasting: Methodo
- Page 153 and 154: the National Agricultural Statistic
- Page 155 and 156: 1.2.3. Other regional and global so
- Page 157 and 158: 1.4. How do these different forecas
- Page 159 and 160: commodity of interest within the op
- Page 161 and 162: Potato and winter wheat acres are c
- Page 163 and 164: During the growing season, the NASS
- Page 165 and 166: 3. Linking up with crop production
- Page 167 and 168: 166 Crop Yield Forecasting: Methodo
- Page 169 and 170: drying have been taken into account
- Page 171 and 172: 170 Crop Yield Forecasting: Methodo
- Page 173 and 174: Meteorological data • USA-NOAA ht
- Page 175 and 176: FIGURE B1.2 Grid covering the area
- Page 177 and 178: Annex B1.2 - The JRC-MARS Crop Yiel
- Page 179 and 180: FIGURE B1.8 MCYFS: Synthetic schema
- Page 181 and 182: FIGURE B1.10 The CGMS Statistical T
- Page 183 and 184: IDSL indicates whether pre-anthesis
- Page 185 and 186: Annex B1.5 - Websites Country Natio
- Page 187 and 188: N_A5 By August 25 Seasonal report o
- Page 189: IV. Official releases of crop produ
- Page 193 and 194: Annex B2.2 - Websites Country China
- Page 195 and 196: FIGURE B3.2 Agrometeorological bull
- Page 197 and 198: FIGURE B3.6 CGMS-MAROC’s web-mapp
- Page 199 and 200: FIGURE B3.10 Crop production foreca
- Page 201 and 202: from the various models are inserte
- Page 203 and 204: FIGURE B3.14 Descriptive schema of
- Page 205 and 206: Annex B3.3 - Websites Country Natio
- Page 207 and 208: FIGURE B4.2 Gross income (South Afr
- Page 209 and 210: Annex B4.3 - Example of SAGIS publi
- Page 211 and 212: 4.2 Definition Oilseeds are defined
- Page 213 and 214: Other countries estimate production
- Page 215 and 216: Annex B4.5 - Advanced Sample Framew
- Page 217 and 218: 216 Crop Yield Forecasting: Methodo
- Page 219 and 220: FIGURE B5.2 USDA-FAS-PECAD: Crop Ex
- Page 221 and 222: FIGURE B5.3A CropScape: Cropland Da
- Page 223 and 224: FIGURE B5.7 Global Agricultural Mon
- Page 225 and 226: 224 Crop Yield Forecasting: Methodo
- Page 227 and 228: Navalgund, R.R., Parihar J.S., Ajai
- Page 229 and 230: Royer, A. & Genovese, G. (eds). 200
- Page 231 and 232: Huang, J., Wang, X., Li, X., Tian,
- Page 233 and 234: Wang, M. & Wei, G. 2014. Promoting
- Page 235 and 236: Zhao, J., Shi, K. & Wei, F. 2007. R
- Page 237 and 238: Hutson, J.L. 1984. Estimation of hy
- Page 239 and 240: Huddleston, H.F. 1978. Sampling tec
- Page 241:
Layout: • Laura Monopoli Cover ph