

Karpouzas et al. - 2006 - Pesticide exposure assessment in rice paddies in E
Karpouzas et al. - 2006 - Pesticide exposure assessment in rice paddies in E
Karpouzas et al. - 2006 - Pesticide exposure assessment in rice paddies in E

Create successful ePaper yourself
Turn your PDF publications into a flip-book with our unique Google optimized e-Paper software.
DG <strong>Karpouzas</strong> <strong>et</strong> <strong>al</strong>.<br />
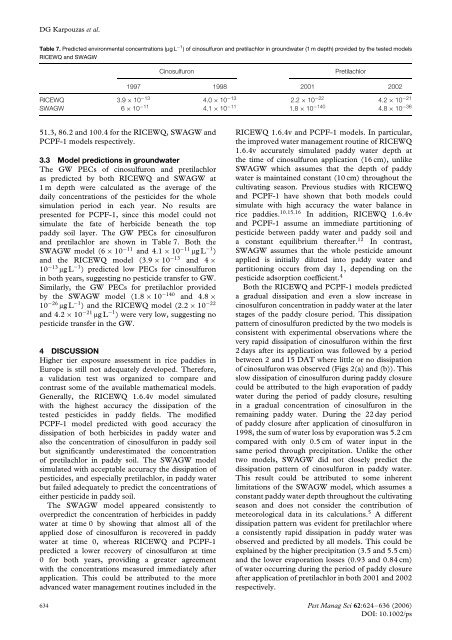
Table 7. Predicted environment<strong>al</strong> concentrations (µgL −1 ) of c<strong>in</strong>osulfuron and pr<strong>et</strong>ilachlor <strong>in</strong> groundwater (1 m depth) provided by the tested models<br />
RICEWQ and SWAGW<br />
C<strong>in</strong>osulfuron<br />
Pr<strong>et</strong>ilachlor<br />
1997 1998 2001 2002<br />
RICEWQ 3.9 × 10 −13 4.0 × 10 −13 2.2 × 10 −22 4.2 × 10 −21<br />
SWAGW 6 × 10 −11 4.1 × 10 −11 1.8 × 10 −140 4.8 × 10 −36<br />
51.3, 86.2 and 100.4 for the RICEWQ, SWAGW and<br />
PCPF-1 models respectively.<br />
3.3 Model predictions <strong>in</strong> groundwater<br />
The GW PECs of c<strong>in</strong>osulfuron and pr<strong>et</strong>ilachlor<br />
as predicted by both RICEWQ and SWAGW at<br />
1 m depth were c<strong>al</strong>culated as the average of the<br />
daily concentrations of the pesticides for the whole<br />
simulation period <strong>in</strong> each year. No results are<br />
presented for PCPF-1, s<strong>in</strong>ce this model could not<br />
simulate the fate of herbicide beneath the top<br />
paddy soil layer. The GW PECs for c<strong>in</strong>osulfuron<br />
and pr<strong>et</strong>ilachlor are shown <strong>in</strong> Table 7. Both the<br />
SWAGW model (6 × 10 −11 and 4.1 × 10 −11 µgL −1 )<br />
and the RICEWQ model (3.9 × 10 −13 and 4 ×<br />
10 −13 µgL −1 ) predicted low PECs for c<strong>in</strong>osulfuron<br />
<strong>in</strong> both years, suggest<strong>in</strong>g no pesticide transfer to GW.<br />
Similarly, the GW PECs for pr<strong>et</strong>ilachlor provided<br />
by the SWAGW model (1.8 × 10 −140 and 4.8 ×<br />
10 −26 µgL −1 )andtheRICEWQmodel(2.2 × 10 −22<br />
and 4.2 × 10 −21 µgL −1 ) were very low, suggest<strong>in</strong>g no<br />
pesticide transfer <strong>in</strong> the GW.<br />
4 DISCUSSION<br />
Higher tier <strong>exposure</strong> <strong>assessment</strong> <strong>in</strong> <strong>rice</strong> <strong>paddies</strong> <strong>in</strong><br />
Europe is still not adequately developed. Therefore,<br />
a v<strong>al</strong>idation test was organized to compare and<br />
contrast some of the available mathematic<strong>al</strong> models.<br />
Gener<strong>al</strong>ly, the RICEWQ 1.6.4v model simulated<br />
with the highest accuracy the dissipation of the<br />
tested pesticides <strong>in</strong> paddy fields. The modified<br />
PCPF-1 model predicted with good accuracy the<br />
dissipation of both herbicides <strong>in</strong> paddy water and<br />
<strong>al</strong>so the concentration of c<strong>in</strong>osulfuron <strong>in</strong> paddy soil<br />
but significantly underestimated the concentration<br />
of pr<strong>et</strong>ilachlor <strong>in</strong> paddy soil. The SWAGW model<br />
simulated with acceptable accuracy the dissipation of<br />
pesticides, and especi<strong>al</strong>ly pr<strong>et</strong>ilachlor, <strong>in</strong> paddy water<br />
but failed adequately to predict the concentrations of<br />
either pesticide <strong>in</strong> paddy soil.<br />
The SWAGW model appeared consistently to<br />
overpredict the concentration of herbicides <strong>in</strong> paddy<br />
water at time 0 by show<strong>in</strong>g that <strong>al</strong>most <strong>al</strong>l of the<br />
applied dose of c<strong>in</strong>osulfuron is recovered <strong>in</strong> paddy<br />
water at time 0, whereas RICEWQ and PCPF-1<br />
predicted a lower recovery of c<strong>in</strong>osulfuron at time<br />
0 for both years, provid<strong>in</strong>g a greater agreement<br />
with the concentrations measured immediately after<br />
application. This could be attributed to the more<br />
advanced water management rout<strong>in</strong>es <strong>in</strong>cluded <strong>in</strong> the<br />
RICEWQ 1.6.4v and PCPF-1 models. In particular,<br />
the improved water management rout<strong>in</strong>e of RICEWQ<br />
1.6.4v accurately simulated paddy water depth at<br />
the time of c<strong>in</strong>osulfuron application (16 cm), unlike<br />
SWAGW which assumes that the depth of paddy<br />
water is ma<strong>in</strong>ta<strong>in</strong>ed constant (10 cm) throughout the<br />
cultivat<strong>in</strong>g season. Previous studies with RICEWQ<br />
and PCPF-1 have shown that both models could<br />
simulate with high accuracy the water b<strong>al</strong>ance <strong>in</strong><br />
<strong>rice</strong> <strong>paddies</strong>. 10,15,16 In addition, RICEWQ 1.6.4v<br />
and PCPF-1 assume an immediate partition<strong>in</strong>g of<br />
pesticide b<strong>et</strong>ween paddy water and paddy soil and<br />
a constant equilibrium thereafter. 12 In contrast,<br />
SWAGW assumes that the whole pesticide amount<br />
applied is <strong>in</strong>iti<strong>al</strong>ly diluted <strong>in</strong>to paddy water and<br />
partition<strong>in</strong>g occurs from day 1, depend<strong>in</strong>g on the<br />
pesticide adsorption coefficient. 4<br />
Both the RICEWQ and PCPF-1 models predicted<br />
a gradu<strong>al</strong> dissipation and even a slow <strong>in</strong>crease <strong>in</strong><br />
c<strong>in</strong>osulfuron concentration <strong>in</strong> paddy water at the later<br />
stages of the paddy closure period. This dissipation<br />
pattern of c<strong>in</strong>osulfuron predicted by the two models is<br />
consistent with experiment<strong>al</strong> observations where the<br />
very rapid dissipation of c<strong>in</strong>osulfuron with<strong>in</strong> the first<br />
2 days after its application was followed by a period<br />
b<strong>et</strong>ween 2 and 15 DAT where little or no dissipation<br />
of c<strong>in</strong>osulfuron was observed (Figs 2(a) and (b)). This<br />
slow dissipation of c<strong>in</strong>osulfuron dur<strong>in</strong>g paddy closure<br />
could be attributed to the high evaporation of paddy<br />
water dur<strong>in</strong>g the period of paddy closure, result<strong>in</strong>g<br />
<strong>in</strong> a gradu<strong>al</strong> concentration of c<strong>in</strong>osulfuron <strong>in</strong> the<br />
rema<strong>in</strong><strong>in</strong>g paddy water. Dur<strong>in</strong>g the 22 day period<br />
of paddy closure after application of c<strong>in</strong>osulfuron <strong>in</strong><br />
1998, the sum of water loss by evaporation was 5.2 cm<br />
compared with only 0.5 cm of water <strong>in</strong>put <strong>in</strong> the<br />
same period through precipitation. Unlike the other<br />
two models, SWAGW did not closely predict the<br />
dissipation pattern of c<strong>in</strong>osulfuron <strong>in</strong> paddy water.<br />
This result could be attributed to some <strong>in</strong>herent<br />
limitations of the SWAGW model, which assumes a<br />
constant paddy water depth throughout the cultivat<strong>in</strong>g<br />
season and does not consider the contribution of<br />
m<strong>et</strong>eorologic<strong>al</strong> data <strong>in</strong> its c<strong>al</strong>culations. 5 Adifferent<br />
dissipation pattern was evident for pr<strong>et</strong>ilachlor where<br />
a consistently rapid dissipation <strong>in</strong> paddy water was<br />
observed and predicted by <strong>al</strong>l models. This could be<br />
expla<strong>in</strong>ed by the higher precipitation (3.5 and 5.5 cm)<br />
and the lower evaporation losses (0.93 and 0.84 cm)<br />
of water occurr<strong>in</strong>g dur<strong>in</strong>g the period of paddy closure<br />
after application of pr<strong>et</strong>ilachlor <strong>in</strong> both 2001 and 2002<br />
respectively.<br />
634 Pest Manag Sci 62:624–636 (<strong>2006</strong>)<br />
DOI: 10.1002/ps


