

Karpouzas et al. - 2006 - Pesticide exposure assessment in rice paddies in E
Karpouzas et al. - 2006 - Pesticide exposure assessment in rice paddies in E
Karpouzas et al. - 2006 - Pesticide exposure assessment in rice paddies in E

You also want an ePaper? Increase the reach of your titles
YUMPU automatically turns print PDFs into web optimized ePapers that Google loves.
DG <strong>Karpouzas</strong> <strong>et</strong> <strong>al</strong>.<br />
were derived us<strong>in</strong>g the PRZM 3.0 user’s manu<strong>al</strong> for<br />
the different porous materi<strong>al</strong>s of the soil horizon. 14<br />
Other param<strong>et</strong>ers such as effective porosity (ϕ,<br />
dimensionless) and residu<strong>al</strong> water phase saturation<br />
(S wr , dimensionless) were c<strong>al</strong>culated with the follow<strong>in</strong>g<br />
formulae:<br />
ϕ = θ s − θ r (16)<br />
S wr = θ r<br />
θ s<br />
(17)<br />
2.6 Statistic<strong>al</strong> an<strong>al</strong>ysis<br />
Model performance was objectively assessed by<br />
compar<strong>in</strong>g the graphic<strong>al</strong> agreement b<strong>et</strong>ween predicted<br />
and observed concentrations of both pesticides <strong>in</strong><br />
paddy water and paddy soil. In addition, the goodness<br />
of fit was assessed us<strong>in</strong>g appropriate statistic<strong>al</strong> <strong>in</strong>dices<br />
<strong>in</strong>clud<strong>in</strong>g root mean square error (RMSE) and<br />
modell<strong>in</strong>g efficiency (EF):<br />
n∑<br />
RMSE = 100<br />
(P i − O i ) 2<br />
√<br />
i=1<br />
(18)<br />
O n<br />
∑<br />
(Oi − O) 2 − ∑ (P i − O i ) 2<br />
EF = ∑ (19)<br />
(Oi − O) 2<br />
where P i and O i are the predicted and observed v<strong>al</strong>ues<br />
respectively, O is the average of the observed v<strong>al</strong>ues<br />
and n is the number of observations. In gener<strong>al</strong>,<br />
the lower the RMSE, the higher is the agreement<br />
b<strong>et</strong>ween measured and predicted data. 28 In contrast,<br />
the optim<strong>al</strong> v<strong>al</strong>ue for EF is 1, and thus the closer to<br />
1 the v<strong>al</strong>ues of EF, the greater is the correspondence<br />
b<strong>et</strong>ween measured and predicted data. 28<br />
3 RESULTS<br />
3.1 Model predictions <strong>in</strong> paddy water<br />
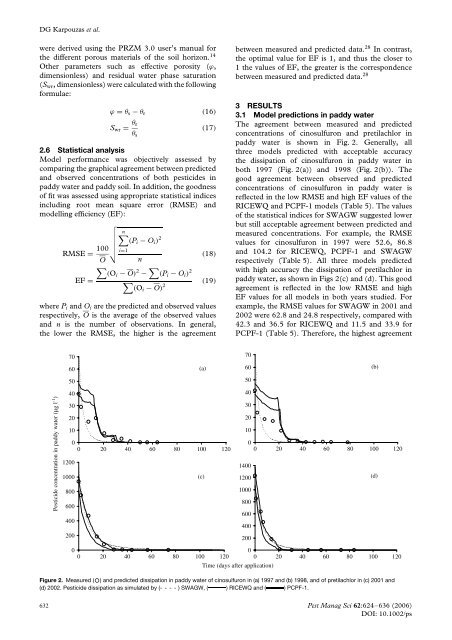
The agreement b<strong>et</strong>ween measured and predicted<br />
concentrations of c<strong>in</strong>osulfuron and pr<strong>et</strong>ilachlor <strong>in</strong><br />
paddy water is shown <strong>in</strong> Fig. 2. Gener<strong>al</strong>ly, <strong>al</strong>l<br />
three models predicted with acceptable accuracy<br />
the dissipation of c<strong>in</strong>osulfuron <strong>in</strong> paddy water <strong>in</strong><br />
both 1997 (Fig. 2(a)) and 1998 (Fig. 2(b)). The<br />
good agreement b<strong>et</strong>ween observed and predicted<br />
concentrations of c<strong>in</strong>osulfuron <strong>in</strong> paddy water is<br />
reflected <strong>in</strong> the low RMSE and high EF v<strong>al</strong>ues of the<br />
RICEWQ and PCPF-1 models (Table 5). The v<strong>al</strong>ues<br />
of the statistic<strong>al</strong> <strong>in</strong>dices for SWAGW suggested lower<br />
but still acceptable agreement b<strong>et</strong>ween predicted and<br />
measured concentrations. For example, the RMSE<br />
v<strong>al</strong>ues for c<strong>in</strong>osulfuron <strong>in</strong> 1997 were 52.6, 86.8<br />
and 104.2 for RICEWQ, PCPF-1 and SWAGW<br />
respectively (Table 5). All three models predicted<br />
with high accuracy the dissipation of pr<strong>et</strong>ilachlor <strong>in</strong><br />
paddy water, as shown <strong>in</strong> Figs 2(c) and (d). This good<br />
agreement is reflected <strong>in</strong> the low RMSE and high<br />
EF v<strong>al</strong>ues for <strong>al</strong>l models <strong>in</strong> both years studied. For<br />
example, the RMSE v<strong>al</strong>ues for SWAGW <strong>in</strong> 2001 and<br />
2002 were 62.8 and 24.8 respectively, compared with<br />
42.3 and 36.5 for RICEWQ and 11.5 and 33.9 for<br />
PCPF-1 (Table 5). Therefore, the highest agreement<br />
<strong>Pesticide</strong> concentration <strong>in</strong> paddy water (µg l -1 )<br />
70<br />
60<br />
(a)<br />
50<br />
40<br />
30<br />
20<br />
10<br />
0<br />
0 20 40 60 80 100 120<br />
1200<br />
1000<br />
(c)<br />
800<br />
600<br />
400<br />
200<br />
70<br />
60<br />
(b)<br />
50<br />
40<br />
30<br />
20<br />
10<br />
0<br />
0 20 40 60 80 100 120<br />
1400<br />
1200<br />
(d)<br />
1000<br />
800<br />
600<br />
400<br />
200<br />
0<br />
0 20 40 60 80 100 120<br />
Time (days after application)<br />
0<br />
0 20 40 60 80 100 120<br />
Figure 2. Measured ) and predicted dissipation <strong>in</strong> paddy water of c<strong>in</strong>osulfuron <strong>in</strong> (a) 1997 and (b) 1998, and of pr<strong>et</strong>ilachlor <strong>in</strong> (c) 2001 and<br />
(d) 2002. <strong>Pesticide</strong> dissipation<br />
(° as simulated by (- - - - ) SWAGW, ( )RICEWQand( )PCPF-1.<br />
632 Pest Manag Sci 62:624–636 (<strong>2006</strong>)<br />
DOI: 10.1002/ps


