

Yoshida und Hara - 1977 - Effects of air temperature and light on grain fill
Yoshida und Hara - 1977 - Effects of air temperature and light on grain fill
Yoshida und Hara - 1977 - Effects of air temperature and light on grain fill

Create successful ePaper yourself
Turn your PDF publications into a flip-book with our unique Google optimized e-Paper software.
96 s. YOSHIDA <str<strong>on</strong>g>and</str<strong>on</strong>g> T. HARA<br />
<str<strong>on</strong>g>temperature</str<strong>on</strong>g> was varied from 16° to 34°0 with a c<strong>on</strong>stant night <str<strong>on</strong>g>temperature</str<strong>on</strong>g> <str<strong>on</strong>g>of</str<strong>on</strong>g> 16°0;<br />
thus, the daily mean <str<strong>on</strong>g>temperature</str<strong>on</strong>g> ranged between 16° <str<strong>on</strong>g>and</str<strong>on</strong>g> 25°0.<br />
Experiment 4. Effict oj <str<strong>on</strong>g>temperature</str<strong>on</strong>g> <str<strong>on</strong>g>and</str<strong>on</strong>g> <str<strong>on</strong>g>light</str<strong>on</strong>g> <strong>on</strong> <strong>grain</strong> <strong>fill</strong>ing. Two levels <str<strong>on</strong>g>of</str<strong>on</strong>g> <str<strong>on</strong>g>light</str<strong>on</strong>g> intensity<br />
(low <str<strong>on</strong>g>light</str<strong>on</strong>g>=36 cal· cm- 2 • day-I; high <str<strong>on</strong>g>light</str<strong>on</strong>g>=1l4 cal· cm- I • day-I) were<br />
combined with two levels <str<strong>on</strong>g>of</str<strong>on</strong>g> <str<strong>on</strong>g>temperature</str<strong>on</strong>g> (23°/15°0 <str<strong>on</strong>g>and</str<strong>on</strong>g> 32°/24°0). The low <str<strong>on</strong>g>light</str<strong>on</strong>g><br />
intensity was achieved by placing a mesh screen beneath the bank <str<strong>on</strong>g>of</str<strong>on</strong>g> <str<strong>on</strong>g>light</str<strong>on</strong>g>s.<br />
RESULTS<br />
Downloaded by [Universitaetsbibliothek Giessen] at 15:43 06 April 2015<br />
Effect oj the daily mean <str<strong>on</strong>g>temperature</str<strong>on</strong>g> <strong>on</strong> <strong>grain</strong> <strong>fill</strong>ing<br />
Grain growth curve. Five daily mean <str<strong>on</strong>g>temperature</str<strong>on</strong>g>s (Table 1) were used, but in this<br />
coverage data will be presented for <strong>on</strong>ly three daily mean <str<strong>on</strong>g>temperature</str<strong>on</strong>g>s (16°, 22°, <str<strong>on</strong>g>and</str<strong>on</strong>g><br />
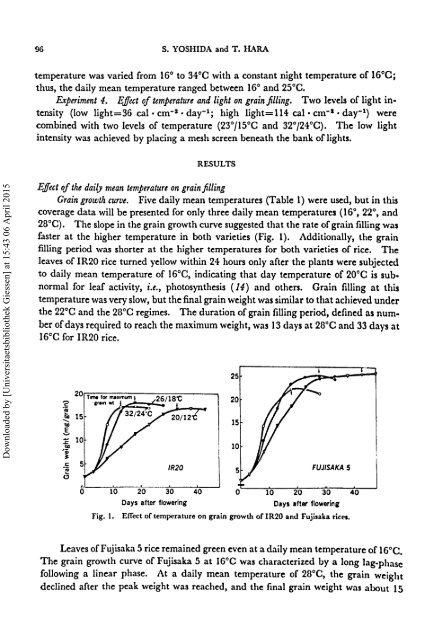
28°0). The slope in the <strong>grain</strong> growth curve suggested that the rate <str<strong>on</strong>g>of</str<strong>on</strong>g> <strong>grain</strong> <strong>fill</strong>ing was<br />
faster at the higher <str<strong>on</strong>g>temperature</str<strong>on</strong>g> in both varieties (Fig. 1). Additi<strong>on</strong>ally, the <strong>grain</strong><br />
<strong>fill</strong>ing period was shorter at the higher <str<strong>on</strong>g>temperature</str<strong>on</strong>g>s for both varieties <str<strong>on</strong>g>of</str<strong>on</strong>g> rice. The<br />
leaves <str<strong>on</strong>g>of</str<strong>on</strong>g> IR20 rice turned yellow within 24 hours <strong>on</strong>ly after the plants were subjected<br />
to daily mean <str<strong>on</strong>g>temperature</str<strong>on</strong>g> <str<strong>on</strong>g>of</str<strong>on</strong>g> 16°0, indicating that day <str<strong>on</strong>g>temperature</str<strong>on</strong>g> <str<strong>on</strong>g>of</str<strong>on</strong>g> 20°0 is subnormal<br />
for leaf activity, i.e., photosynthesis (14) <str<strong>on</strong>g>and</str<strong>on</strong>g> others. Grain <strong>fill</strong>ing at this<br />
<str<strong>on</strong>g>temperature</str<strong>on</strong>g> was very slow, but the final <strong>grain</strong> weight was similar to that achieved <str<strong>on</strong>g>und</str<strong>on</strong>g>er<br />
the 22°0 <str<strong>on</strong>g>and</str<strong>on</strong>g> the 28°0 regimes. The durati<strong>on</strong> <str<strong>on</strong>g>of</str<strong>on</strong>g> <strong>grain</strong> <strong>fill</strong>ing period, defined as number<br />
<str<strong>on</strong>g>of</str<strong>on</strong>g> days required to reach the maximum weight, was 13 days at 28°0 <str<strong>on</strong>g>and</str<strong>on</strong>g> 33 days at<br />
16°0 for IR20 rice.<br />
..... 20<br />
c::<br />
.OJ<br />
......<br />
&.<br />
tlO 15<br />
E<br />
'-'<br />
....<br />
.s:::<br />
tlO<br />
'iii<br />
~<br />
c::<br />
.iij fUJISAKA 5<br />
...<br />
0<br />
0 10 20 30 40 o 10 20 30 40<br />
Days after flowering<br />
Days Ifter flowerini<br />
Fig. 1.<br />
25<br />
10<br />
Effect <str<strong>on</strong>g>of</str<strong>on</strong>g> <str<strong>on</strong>g>temperature</str<strong>on</strong>g> <strong>on</strong> <strong>grain</strong> growth <str<strong>on</strong>g>of</str<strong>on</strong>g> IR20 <str<strong>on</strong>g>and</str<strong>on</strong>g> Fujisaka riel'S.<br />
Leaves <str<strong>on</strong>g>of</str<strong>on</strong>g> Fujisaka 5 rice remained green even at a daily mean <str<strong>on</strong>g>temperature</str<strong>on</strong>g> <str<strong>on</strong>g>of</str<strong>on</strong>g> 16°C.<br />
The <strong>grain</strong> growth curve <str<strong>on</strong>g>of</str<strong>on</strong>g> Fujisaka 5 at 16°0 was characterized by a l<strong>on</strong>g lag-phase<br />
following a linear phase. At a daily mean <str<strong>on</strong>g>temperature</str<strong>on</strong>g> <str<strong>on</strong>g>of</str<strong>on</strong>g> 28°C, the <strong>grain</strong> weight<br />
declined after the peak weight was reached, <str<strong>on</strong>g>and</str<strong>on</strong>g> the final <strong>grain</strong> weight was about 15


