

THE NOURISHING EFFECT
HR2016-Full-Report-Web
HR2016-Full-Report-Web

You also want an ePaper? Increase the reach of your titles
YUMPU automatically turns print PDFs into web optimized ePapers that Google loves.
most effective counter-cyclical program to offset the<br />
inevitable downturns in economic activity and availability<br />
of jobs that is systemically built into the U.S.<br />
economy. WIC provides nutrition education and<br />
medical services in addition to food targeted specifically<br />
to pregnant and lactating mothers, and infants<br />
and children.<br />
In addition to providing much needed food and<br />
other services for low-income and food-insecure families<br />
and individuals, the private food assistance system<br />
also provides opportunities for corporations to remove<br />
unprofitable product from their inventories, reduce<br />
their tax burdens, and improve public perceptions of<br />
their degree of social responsibility. In addition, both<br />
the public and private food assistance systems provide<br />
much-needed jobs, many of which pay very well.<br />
It is also extremely important to note that the public<br />
and private food assistance systems comprise complementary<br />
systems for dealing with food insecurity and<br />
hunger, with overlap and interaction between the two<br />
systems. And it is necessary to state the obvious fact<br />
that the two systems combined are still far from adequate<br />
solutions to the problems of food insecurity and<br />
hunger. Food insecurity and hunger, like poverty, their<br />
main proximal cause, are systemic problems that result<br />
from numerous market, policy, and leadership failures.<br />
And they will not be eliminated until those systemic<br />
failures are acknowledged, addressed, and resolved.<br />
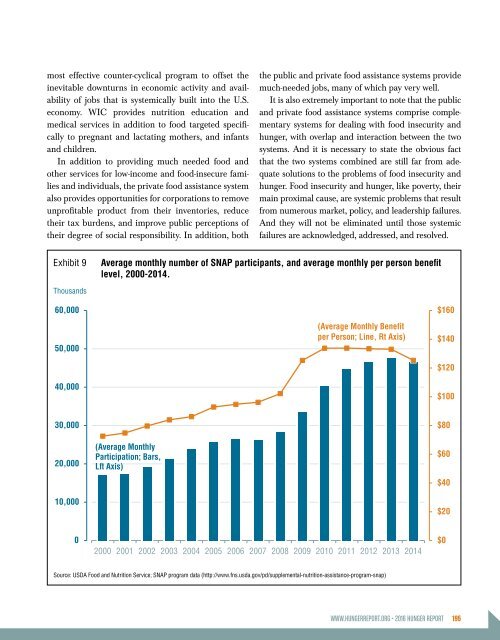
Exhibit 9<br />
Average monthly number of SNAP participants, and average monthly per person benefit<br />
level, 2000-2014.<br />
Thousands<br />
60,000<br />
50,000<br />
40,000<br />
(Average Monthly Benefit<br />
per Person; Line, Rt Axis)<br />
$160<br />
$140<br />
$120<br />
$100<br />
30,000<br />
$80<br />
20,000<br />
10,000<br />
(Average Monthly<br />
Participation; Bars,<br />
Lft Axis)<br />
$60<br />
$40<br />
$20<br />
0<br />
2000 2001 2002 2003 2004 2005 2006 2007 2008 2009 2010 2011 2012 2013 2014<br />
$0<br />
Source: USDA Food and Nutrition Service; SNAP program data (http://www.fns.usda.gov/pd/supplemental-nutrition-assistance-program-snap)<br />
WWW.HUNGERREPORT.ORG • 2016 HUNGER REPORT 195